


 FxWirePro:EUR/NZD dips below lower range, bearish bias increases
  Energy Sector Outlook 2025: AI's Role and Market Dynamics
  U.S. Stocks vs. Bonds: Are Diverging Valuations Signaling a Shift?
  S&P 500 Relies on Tech for Growth in Q4 2024, Says Barclays
  FxWirePro- Major Crypto levels and bias summary
  FxWirePro: GBP/USD advance after softer US inflation dims Fed rate hike bets
  FxWirePro:EUR/NZD extends fall, key support lies ahead
  Moody's Upgrades Argentina's Credit Rating Amid Economic Reforms
  GBPUSD, AUDUSD & NZDUSD Turn Extremely Bullish: Strong Positive Momentum Drives Major Pair Action Bias
  FxWirePro :USD/JPY bulls loosen their grip a bit, dips to be bought
  Goldman Predicts 50% Odds of 10% U.S. Tariff on Copper by Q1 Close
  Trump’s "Shock and Awe" Agenda: Executive Orders from Day One
  FxWirePro: EUR/AUD outlook weaker on renewed downside pressure


There have been streak of mixed bag of news (but more adverse) that’s been lingering around cryptocurrency space. Some unpleasant news has come in from Goldman Sachs in the recent past, as a result, bitcoin prices slid to three-week’s low as Goldman Sachs Group Inc. is pulling back to defer crypto projects to set up a trading desk. While US SEC has declined ETF proposals, eyeing on stringent regulatory framework.
On the other hand, when the renowned bitcoin exchange, Mt. Gox creditor’s fiasco has posed a risk to the cryptocurrency industry, the crypto-veterans have got cause of concern as to how this adverse condition will evolve. When the exchange went offline, huge amount of money was stolen from its clients. Approximately, $1 billion worth of funds has been recovered after several years. This money parks in the exchange trustee’s control and the payments likely to begin dribbling in the weeks to come. Outstanding BTCs would be paid back to the victims of the defunct company.
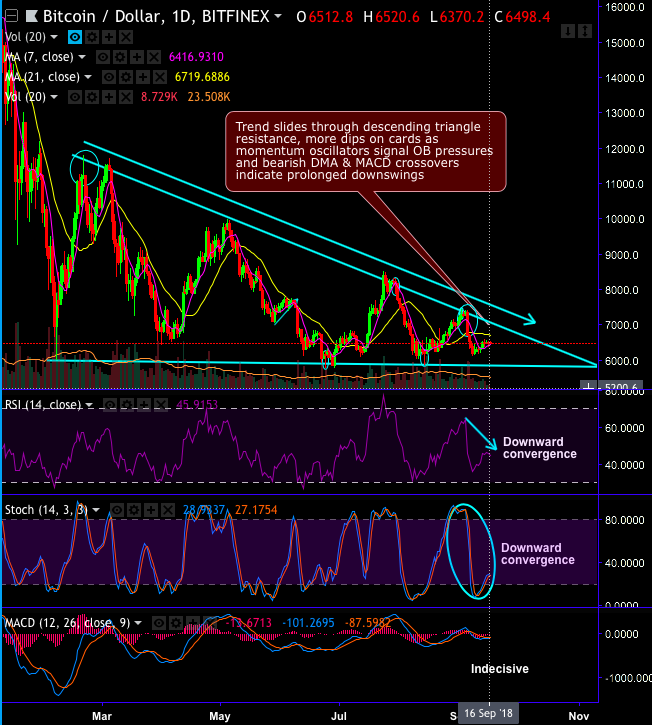
But technically, we had raised red flags for aggressive bulls in our recent posts. Consequently, BTCUSD forms descending triangle pattern on daily terms. You could notice that this pair shown a considerable bearish potential as and when the price hits descending triangle resistance in the past. Thereby, history has repeated this time as well since the current prices are slid below DMAs.
Although the bulls of this pair have attempted to bounce back today from the yesterday’s lows of $6,370.50 levels to the recent highs of $6,543 levels, but the bearish sentiments are still imminent especially after the formation of shooting star and hanging man patterns in the range-bounded trend (refer 4H chart).
However, the bullish potential in the long-run cannot be ruled out. Since it costs about $6,000 to mine a bitcoin and it couldn’t exceed anything lower than that.
But the real cause of concern for the short-term traders is that both momentum oscillators (RSI & stochastic curves) signal overbought pressures as they display bearish RSI & stochastic divergence.
While evaluating the future prices for this unconventional currency BTCUSD. Pricing BTC vanilla options at ORE is not straight forwards as it’s a new and a very volatile instrument. ORE seems to be exploiting with advanced mathematical models and techniques to try and infer future behavior of BTC.
Capitalizing on such Bitcoin vanilla options, BTC option traders can get a clarity aboyt bitcoin future prices and volatility to certain extent.
FxWirePro’s Currency Strength Index: Hourly BTC spot index is flashing 47 (which is bullish), while hourly USD spot index was at shy above -86 (bearish) at 05:41 GMT. For more details on the index, please refer below weblink:


