


 Goldman Sachs: US Dollar Likely to Stay Strong Despite Oil Price Retreat
  Today’s space race could turn fatal if we don’t agree on new rules
  How AI prompting turned writerly description into an everyday skill
  FxWirePro- Major Crypto levels and bias summary
  Sell the Bounce": Gold Rally Stalls Near $4165 as Fed Hawks Slam the Door on Rate Cuts — Targets $4000/$3600


Over the past week, institutional demand for U. S. spot Bitcoin ETFs surged, as evidenced by a record single-day net inflow of roughly $602–$603 million on July 3, 2025, mostly from major players like Fidelity and BlackRock. Bitcoin spot ETFs saw more than $3 billion in net inflows over the last two weeks, bringing total assets under management to $137 billion. This abrupt increase shows a sharp turnaround from earlier withdrawals and shows renewed confidence in Bitcoin ETF institutions.
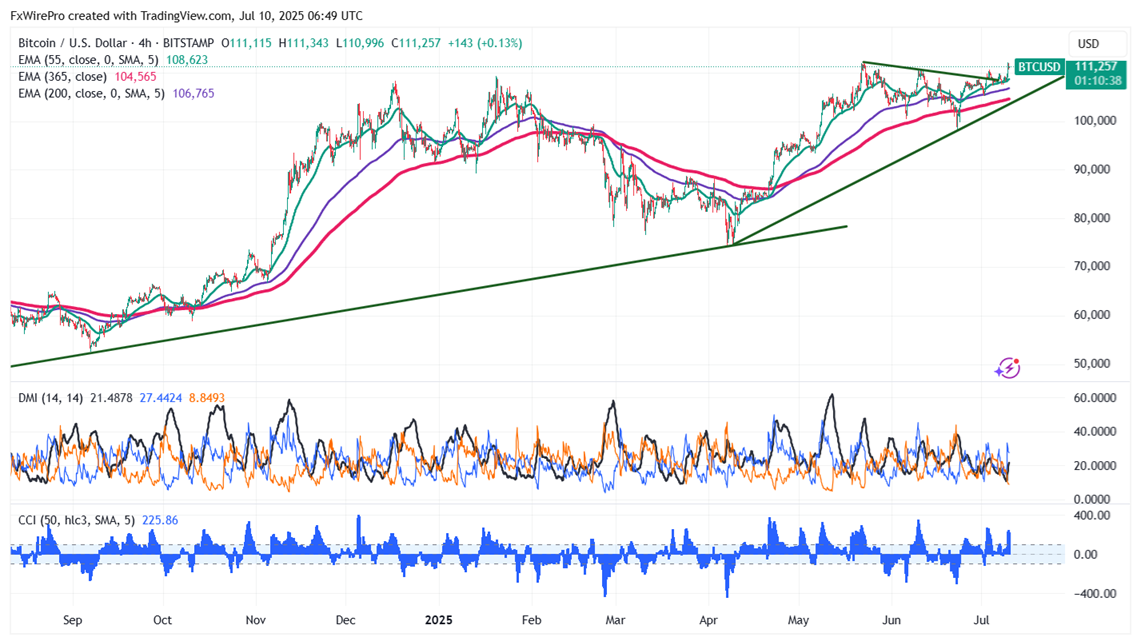
Technical Analysis: Key Levels to Watch for BTC/USD
BTC/USD breaks significant resistance $112000 and hits a fresh all-time high. It trades above both short-term (34-EMA and 55-EMA) and long-term (200-EMA) moving averages on the 4-hour chart. Minor support is around $108000; breaking below this would drag the pair down to $103000/$10000/$94660/$90000. Immediate resistance is around $112,000, indicating that closing above this level could lead to targets at $115,000, or even $135,000.
Investment Strategy: Opportunities for Traders
Indicators (4-hour chart).
CCI(500- Bullish
Directional movement index - Bullish
It is good to buy on dips around $108000 with a stop-loss set at $105000 for a TP of $135000.


