


 State of emergency in Crimea as Ukraine focuses pressure on ‘jewel in Putin’s crown’
  In a rebuke to Trump, the Supreme Court rules that birthright citizenship is the law of the land
  Gold Surges Past $4150 on Dovish Fed Signals and Weak Jobs Data; Bullish Outlook Prevails
  Goldman AM Sees Strong Buyout Opportunities in Japan, South Korea and Australia
  USA at 250: the Black American struggle for life, liberty and the pursuit of happiness
  Citi Raises TSMC Price Target as AI Chip Demand Strengthens Growth Outlook
  Alcohol is one of the most dangerous drugs, yet its presence is ubiquitous in social settings and celebrations
  Goldman Sachs Says China Competition Weighs More on EU Growth Than Trade Deficit
  Trump has made more than $1 billion from crypto in a year. How?


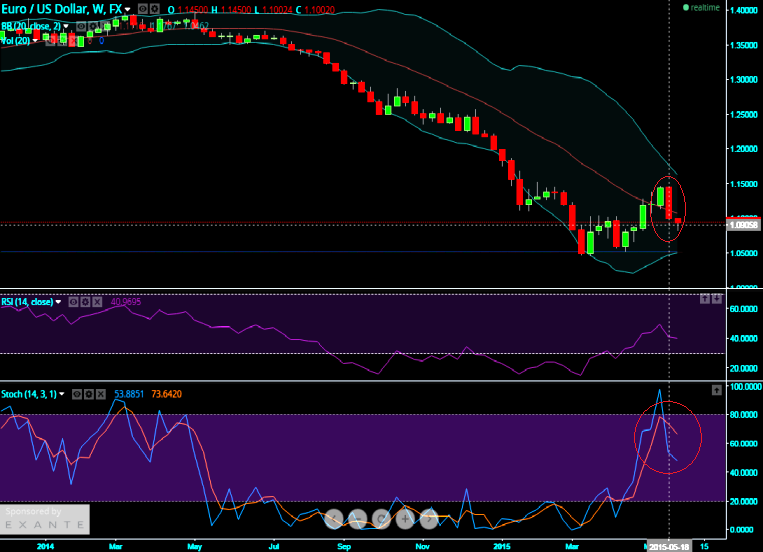
Technical insights: EURUSD:
On a weekly chart the pair formed a bearish engulfing pattern candle with tall real body engulfs completely the previously formed two and half weeks bullish momentum which signifies the downside risks to this pair.
Stochastic confirming the overbought situation as %D line crossover occurred near 80 levels on the same which is bearish sign again.
RSI (14) began showing downward convergence to the price line adds more pressure to the slumps.
But on daily chart the same pair trending at a crucial support around 1.0906 levels. If it manages to breach this crucial support then we could certainly see the pair testing below target levels with strict stop loss as well.
T1: 1.08510
T2: 1.0565
SL: 1.0976

- News

- Economy

- Central Banks
- Investing
- Research
- Roundups
- Digital Currency
- Insights
- Technical Analysis
- Technology
- Business
- Law
- Health
- Nature
- Fintech
- Science
- Topic
- Opinions
- ©Econometrics LLC . All Rights Reserved.
Bearish engulfing on EURUSD drags to further slumps
Friday, May 29, 2015 7:14 AM UTC
Editor's Picks


- Market Data
Most Popular


