


 FxWirePro- Major Crypto levels and bias summary


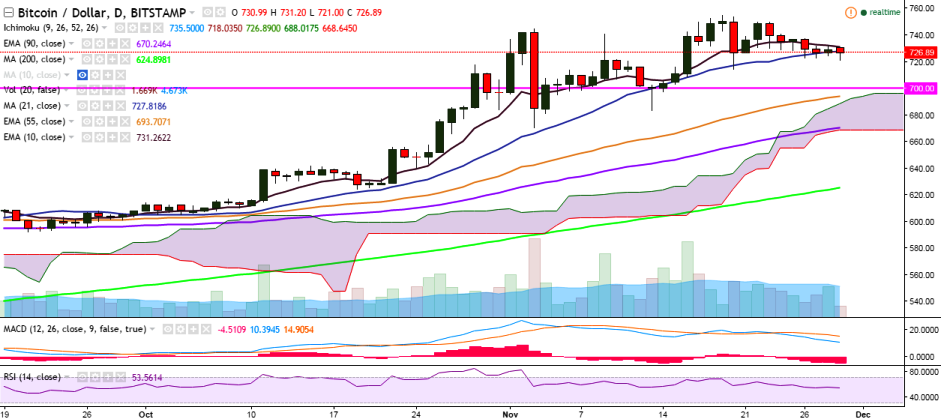
BTC/USD continues to hover around 21-day MA and is trading at 726 levels at the time of writing (Bitstamp).
Long-term trend: Bullish
Ichimoku analysis of daily chart:
Tenkan Sen: 733.91
Kijun Sen: 712.69
Trend reversal: 668.97 (90 EMA)
The pair’s upside is being capped by 732.23 levels (10-EMA) and a break above would see it testing 755 levels (November 19 high)/778.85 (June 18 high).
On the downside, the pair is trading slightly below 726.98 (21-day MA) and a close below would confirm minor bearishness in the pair, and weaken it to 714 (November 20 low)/ 702 (61.8% retracement of 670.32 and 755.07).

- News

- Economy

- Central Banks
- Investing
- Research
- Roundups
- Digital Currency
- Insights
- Technical Analysis
- Technology
- Business
- Law
- Health
- Nature
- Fintech
- Science
- Topic
- Opinions
- ©Econometrics LLC . All Rights Reserved.
BTC/USD upside capped by 10-EMA, close below confirms minor bearishness
Tuesday, November 29, 2016 9:22 AM UTC
Editor's Picks


- Market Data
Most Popular


