


 FxWirePro- Major Crypto levels and bias summary
  Ethereum Cracks Under $1,700: Sell the Rally Near $1,750 as Bears Eye $1,380–$1,200
  FxWirePro- Major Crypto levels and bias summary


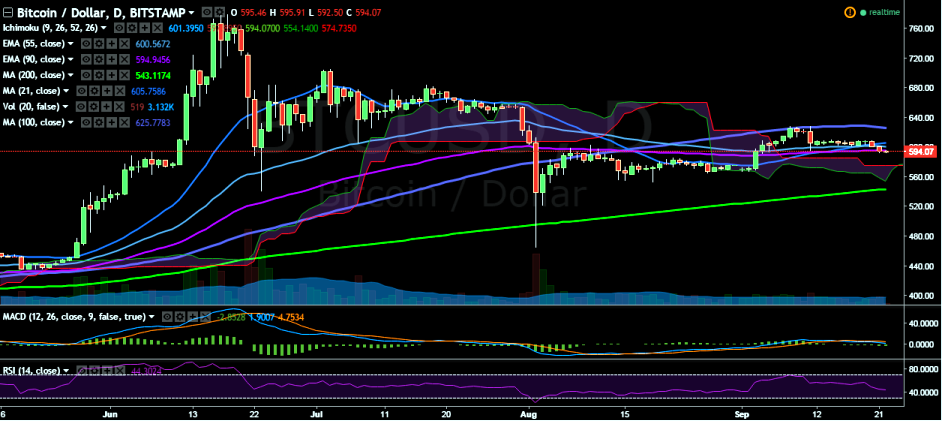
BTC/USD is continuing to trade weak below 600 levels on Thursday. It is currently hovering around 90-EMA and is trading at 594.90 levels (Bitstamp).
Long-term trend: Bullish
Short-term trend: Bearish
Ichimoku analysis of daily chart:
Tenkan Sen: 601.39
Kijun Sen: 596.90
Trend reversal: 594.96 (90 EMA)
“The pair has declined sharply after hitting 609.50 levels and fallen below 600 levels. It has broken below September 11 low of 594.63 levels and a close below 90-EMA would see a further dip till $550 levels”, FxWirePro said in a statement.
On the top side, major resistance is seen at 600 (55 EMA) and a break above would see the pair testing 610 levels (psychological)/ 628 (September 11 high).
On the downside, support is likely to be found at $550 levels (psychological) and any violation would further weaken the pair to 542.17 (200-day MA)/527 (61.8% retracement of 465.28 and 628.99).

- News

- Economy

- Central Banks
- Investing
- Research
- Roundups
- Digital Currency
- Insights
- Technical Analysis
- Technology
- Business
- Law
- Health
- Nature
- Fintech
- Science
- Topic
- Opinions
- ©Econometrics LLC . All Rights Reserved.
BTC/USD trades weak, dip till 550 likely
Thursday, September 22, 2016 6:52 AM UTC
Editor's Picks


- Market Data
Most Popular


