


 FxWirePro- Major Crypto levels and bias summary
  Ethereum Cracks Under $1,700: Sell the Rally Near $1,750 as Bears Eye $1,380–$1,200
  FxWirePro- Major Crypto levels and bias summary
  FxWirePro- Major Crypto levels and bias summary


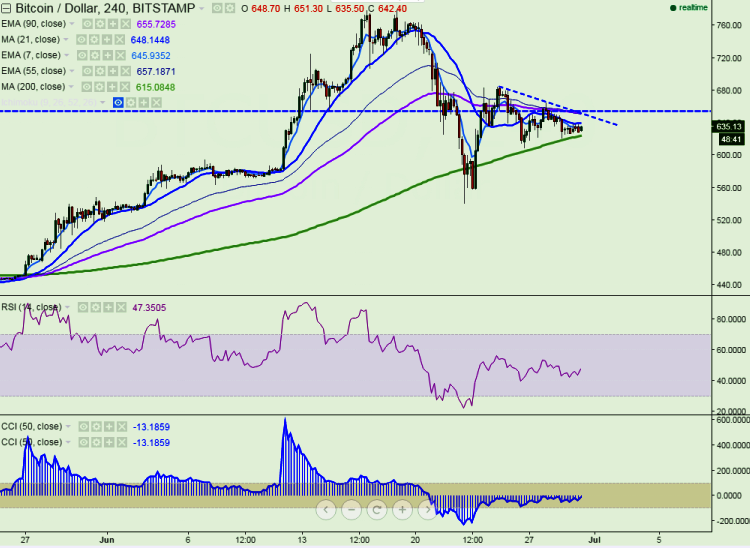
BTC/USD seems to struggling to turn green on Thursday, reversing the downtrend seen from the past two days. It currently trades at $636.92 levels at press time (Bitstamp). In the 4-hour chart, the pair’s northward move is facing major resistance from 21 4H MA.
Ichimoku analysis (4 Hour chart):
Tenkan-Sen level: $643.30
Kijun-Sen level: $646.54
Trend reversal level - (90 day EMA)-$654
The pair has slightly jumped after making a low of $621. The long-term trend is bullish, however, short-term trend appears bearish.
BTC/USD is facing trend line resistance at $654 and slight bullishness only above that level. Major resistance is around $654 (trend line joining $684.45 and $665) and any break above targets $665 (Jun 28 high)/$685 (Jun 25 high). The short-term support is seen at $622 (200 4H MA) and any violation below will drag the pair till $595 (61.8% retracement of $540 and $683)/$540 (Jun 23 rd low).

- News

- Economy

- Central Banks
- Investing
- Research
- Roundups
- Digital Currency
- Insights
- Technical Analysis
- Technology
- Business
- Law
- Health
- Nature
- Fintech
- Science
- Topic
- Opinions
- ©Econometrics LLC . All Rights Reserved.
BTC/USD trades rangebound, weakness below $622
Thursday, June 30, 2016 7:35 AM UTC
Editor's Picks


- Market Data
Most Popular


