


 FxWirePro- Major Crypto levels and bias summary
  FxWirePro- Major Crypto levels and bias summary
  FxWirePro- Major Crypto levels and bias summary


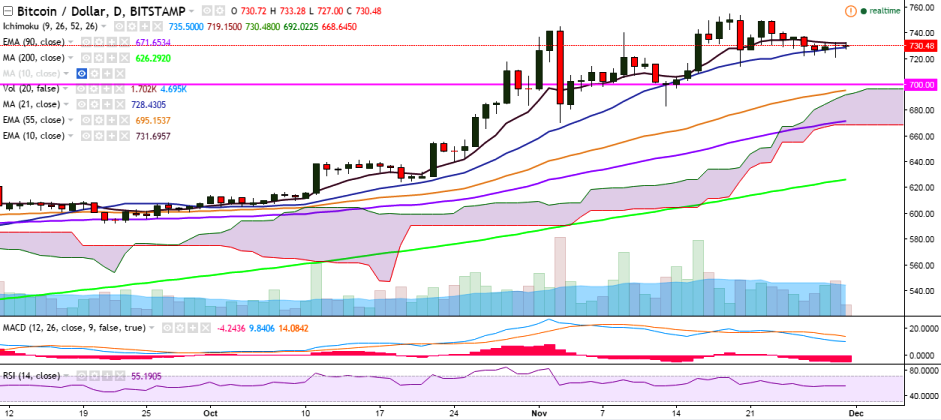
BTC/USD is trading in a tight range on Wednesday, with its movement restricted between 10-EMA and 21-day MA. It is currently trading at 731 levels at the time of writing (Bitstamp).
Long-term trend: Bullish
Ichimoku analysis of daily chart:
Tenkan Sen: 735.50
Kijun Sen: 718
Trend reversal: 670.33 (90 EMA)
On the upside, the pair is facing strong resistance at 731.96 levels (10-EMA) and a break above would see it testing 755 levels (November 19 high)/778.85 (June 18 high). Only a break above 755 levels would make way for further upside.
On the downside, 728 levels (21-day MA) is acting as a major support for the pair. Any violation would weaken it to 714 (November 20 low)/ 702 (61.8% retracement of 670.32 and 755.07).

- News

- Economy

- Central Banks
- Investing
- Research
- Roundups
- Digital Currency
- Insights
- Technical Analysis
- Technology
- Business
- Law
- Health
- Nature
- Fintech
- Science
- Topic
- Opinions
- ©Econometrics LLC . All Rights Reserved.
BTC/USD trades rangebound, further bullishness only above 755
Wednesday, November 30, 2016 8:19 AM UTC
Editor's Picks


- Market Data
Most Popular


