


 FxWirePro- Major Crypto levels and bias summary
  Ethereum Cracks Under $1,700: Sell the Rally Near $1,750 as Bears Eye $1,380–$1,200
  BTC’s Bear Bounce: Sell the Rally Near $66K as Bears Target $59K–$52K Breakdown
  FxWirePro- Major Crypto levels and bias summary


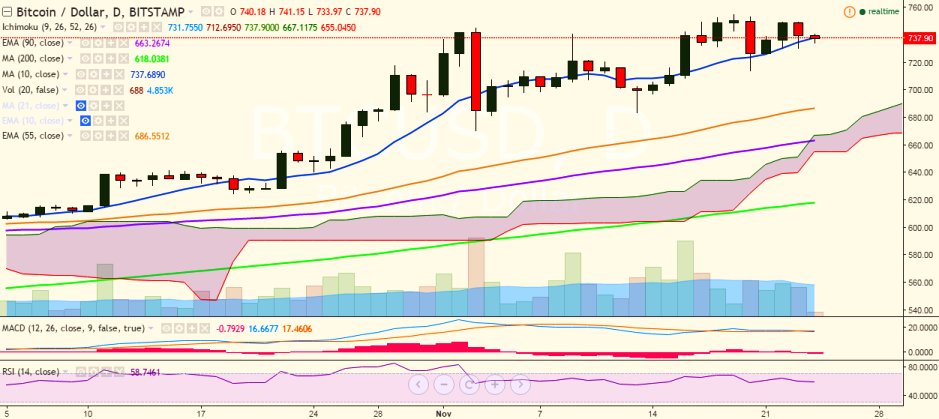
BTC/USD is trading in a narrow range between 733 and 741 on Thursday. It is currently trading at 537 levels (Bitstamp).
Long-term trend: Bullish
Short-term trend: Bullish
Ichimoku analysis of daily chart:
Tenkan Sen: 729.06
Kijun Sen: 712.69
Trend reversal: 661.59 (90 EMA)
The pair is facing major resistance at 750 levels (psychological) and minor bullishness would be seen if it breaks above 755 levels (November 19 high). Further strength would see the pair testing 778.85 (June 18 high)/800 (psychological level).
On the reverse side, the pair is trying to hold its strength above 734.28 (10-day MA) and a break below would drag it to 714 (November 20 low)/ 702 (61.8% retracement of 670.32 and 755.07).

- News

- Economy

- Central Banks
- Investing
- Research
- Roundups
- Digital Currency
- Insights
- Technical Analysis
- Technology
- Business
- Law
- Health
- Nature
- Fintech
- Science
- Topic
- Opinions
- ©Econometrics LLC . All Rights Reserved.
BTC/USD trades rangebound, break above 755 confirms minor bullishness
Thursday, November 24, 2016 9:40 AM UTC
Editor's Picks


- Market Data
Most Popular


