


 BTC’s Bear Bounce: Sell the Rally Near $66K as Bears Target $59K–$52K Breakdown
  FxWirePro- Major Crypto levels and bias summary


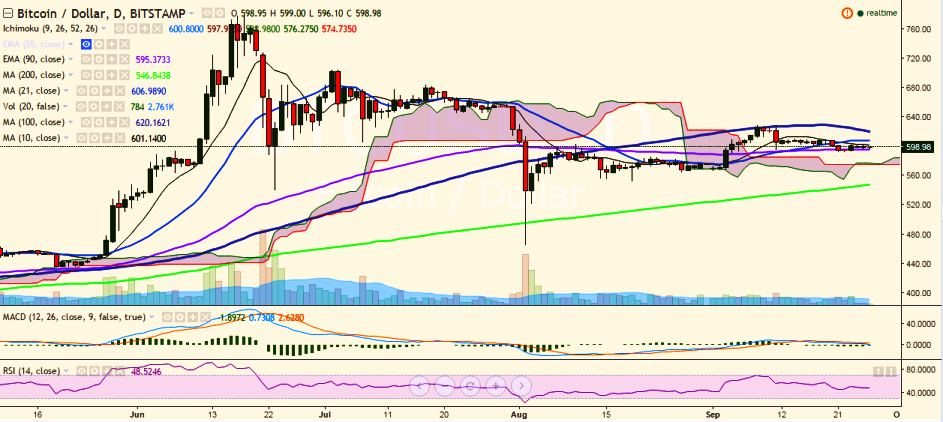
BTC/USD is trading flat and holing its strength above 90 EMA. The pair’s upside is being capped by 10-day MA. At the time of writing, it is trading below the 600 mark at 598.30 levels.
Long-term trend: Bullish
Short-term trend: Bearish
Ichimoku analysis of daily chart:
Tenkan Sen: 600.80
Kijun Sen: 597.92
Trend reversal: 595.29 (90 EMA)
“The pair has taken support near 90-EMA and a break below would further weaken it to 550 levels”, FxWirePro said in a statement.
Major resistance is seen at 607.20 (21-day MA) and a break above would target September 11 high of 628 (September 11 high). A break above this level would confirm further bullishness and see the pair testing 651.79 (161.8% retracement of 628.99 and 592.10).
On the flipside, a break below 595.29 (90 EMA) would target 545.92 (200-day MA)/527 (61.8% retracement of 465.28 and 628.99).

- News

- Economy

- Central Banks
- Investing
- Research
- Roundups
- Digital Currency
- Insights
- Technical Analysis
- Technology
- Business
- Law
- Health
- Nature
- Fintech
- Science
- Topic
- Opinions
- ©Econometrics LLC . All Rights Reserved.
BTC/USD takes support near 90-EMA, break below targets 550
Monday, September 26, 2016 7:30 AM UTC
Editor's Picks


- Market Data
Most Popular


