


 Ethereum Cracks Under $1,700: Sell the Rally Near $1,750 as Bears Eye $1,380–$1,200
  FxWirePro- Major Crypto levels and bias summary
  FxWirePro- Major Crypto levels and bias summary
  FxWirePro- Major Crypto levels and bias summary
  BTC’s Bear Bounce: Sell the Rally Near $66K as Bears Target $59K–$52K Breakdown


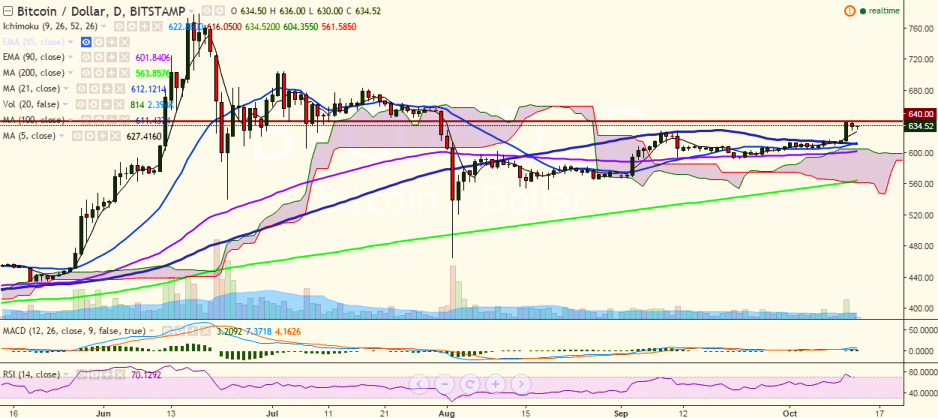
BTC/USD is hovering around yesterday’s close of 634 levels at the time of writing. The pair is trading well above 5-day MA suggesting a further bullish trend is likely to follow (Bitstamp).
Long-term trend: Bullish
Short-term trend: Bullish
Ichimoku analysis of daily chart:
Tenkan Sen: 622.49
Kijun Sen: 616.05
Trend reversal: 601.10 (90 EMA)
“The pair seems to have taken support near 5-day MA. This along with the crossover of 21-DMA and 100-DMA suggests further jump in the pair. It must break above the previous high of 640 levels for further bullishness”, FxWirePro said in a statement.
Immediate resistance is seen at 640 (October 12 high) and a break above would target 651.79 (161.8% retracement of 628.99 and 592.10)/ 704.99 (July 03 high)
On the downside, support is likely to be found at 623.38 (5-day MA) and a break below would drag the pair to 601.10 (90 EMA)/552.30 (August 19 low).

- News

- Economy

- Central Banks
- Investing
- Research
- Roundups
- Digital Currency
- Insights
- Technical Analysis
- Technology
- Business
- Law
- Health
- Nature
- Fintech
- Science
- Topic
- Opinions
- ©Econometrics LLC . All Rights Reserved.
BTC/USD takes support near 5-DMA, break above 640 targets 700
Thursday, October 13, 2016 8:53 AM UTC
Editor's Picks


- Market Data
Most Popular


