


 FxWirePro- Major Crypto levels and bias summary
  FxWirePro- Major Crypto levels and bias summary
  FxWirePro- Major Crypto levels and bias summary


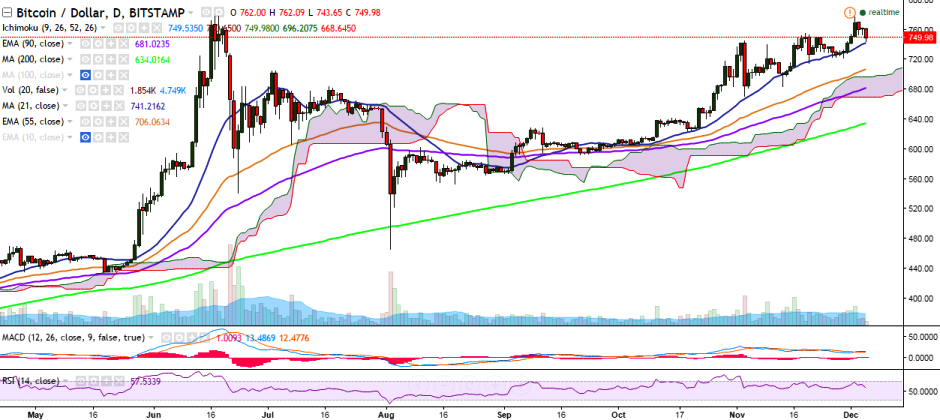
BTC/USD is showing a dip after it hit a fresh high of 778.07 levels on December 02. It is currently trading in the red at 749 levels (Bitstamp).
Long-term trend: Bullish
Short-term trend: Bullish
Ichimoku analysis of daily chart:
Tenkan Sen: 749.53
Kijun Sen: 730.65
Trend reversal: 679.47 (90 EMA)
The pair must break above 778.85 (June 18 high) for further upside. Any violation would see the pair testing 799.34 (161.8% retracement of 778.07 and 743.65)/ 819.61 (113% retracement of 778.85 and 465.28).
On the down side, 739 (21-day MA) continues to act as a major support for the pair and a break below would see a dip till 714 (November 20 low)/ 704 (55-EMA).

- News

- Economy

- Central Banks
- Investing
- Research
- Roundups
- Digital Currency
- Insights
- Technical Analysis
- Technology
- Business
- Law
- Health
- Nature
- Fintech
- Science
- Topic
- Opinions
- ©Econometrics LLC . All Rights Reserved.
BTC/USD takes support near 21-DMA, further bullishness only above 778
Monday, December 5, 2016 7:03 AM UTC
Editor's Picks


- Market Data
Most Popular


