


 Ethereum Cracks Under $1,700: Sell the Rally Near $1,750 as Bears Eye $1,380–$1,200


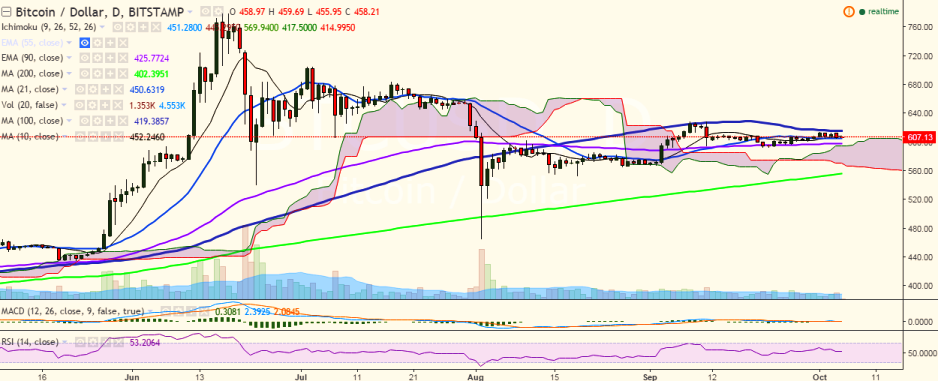
BTC/USD failed to break above 100-DMA and has slipped below 10-DMA. It is currently trading at 606 levels at the time of writing (Bitstamp).
Long-term trend: Bullish
Short-term trend: Bearish
Ichimoku analysis of daily chart:
Tenkan Sen: 605.19
Kijun Sen: 610.54
Trend reversal: 597.48 (90 EMA)
“The pair has taken support near 604.84 (21-DMA) and is trading slightly above this level. Short-term trend appears bearish and a close below 21-DMA could a dip till 597.48 (90 EMA)”, FxWirePro said in a statement.
Major resistance is seen at 615.42 (100-day MA) and a break above would see the pair testing 628.99 (September 11 high) and then 651.79 (161.8% retracement of 628.99 and 592.10).
On the reverse side, the pair will find support at 604.84 (21-DMA) and a break below would target 600 (psychological levels)/ 597.26 (90 EMA)/ 578.39 (161.8% retracement of 592.10 and 614.28).

- News

- Economy

- Central Banks
- Investing
- Research
- Roundups
- Digital Currency
- Insights
- Technical Analysis
- Technology
- Business
- Law
- Health
- Nature
- Fintech
- Science
- Topic
- Opinions
- ©Econometrics LLC . All Rights Reserved.
BTC/USD takes support near 21-DMA, break below targets 597
Wednesday, October 5, 2016 7:17 AM UTC
Editor's Picks


- Market Data
Most Popular


