


 FxWirePro- Major Crypto levels and bias summary
  FxWirePro- Major Crypto levels and bias summary
  BTC’s Bear Bounce: Sell the Rally Near $66K as Bears Target $59K–$52K Breakdown
  FxWirePro- Major Crypto levels and bias summary


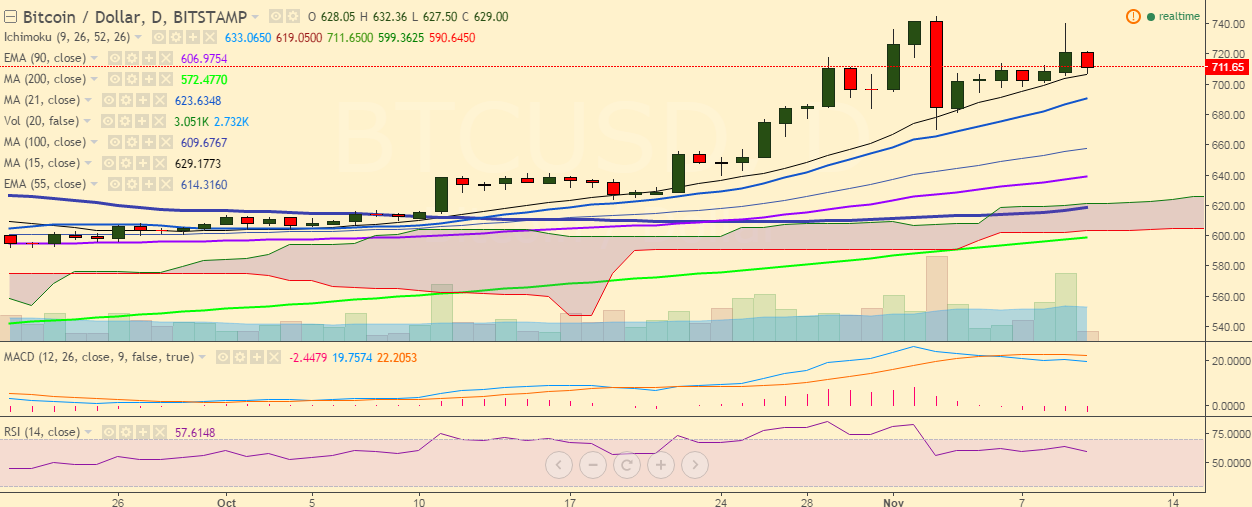
BTC/USD is showing a slight dip after it hit 740.86 levels on Wednesday. It is currently trading at 713 levels (Bitstamp).
Long-term trend: Bullish
Short-term trend: Bullish
Ichimoku analysis of daily chart:
Tenkan Sen: 707.75
Kijun Sen: 684.66
Trend reversal: 637.27 (90 EMA)
On the upside, further bullishness in the pair could be seen only if it breaches 745 levels (November 03 high). A break above this level would target 778.85 (June 18 high)/ 800.00.
On the reverse side, 15-day MA (703 levels) is acting as a strong support for the pair. A break below this levels would see the pair falling to 686 (21-day MA) and then to 655 (55 EMA).

- News

- Economy

- Central Banks
- Investing
- Research
- Roundups
- Digital Currency
- Insights
- Technical Analysis
- Technology
- Business
- Law
- Health
- Nature
- Fintech
- Science
- Topic
- Opinions
- ©Econometrics LLC . All Rights Reserved.
BTC/USD takes support near 15-DMA, further bullishness only above 745
Thursday, November 10, 2016 8:27 AM UTC
Editor's Picks


- Market Data
Most Popular


