


 FxWirePro- Major Crypto levels and bias summary
  FxWirePro- Major Crypto levels and bias summary
  FxWirePro- Major Crypto levels and bias summary
  FxWirePro- Major Crypto levels and bias summary


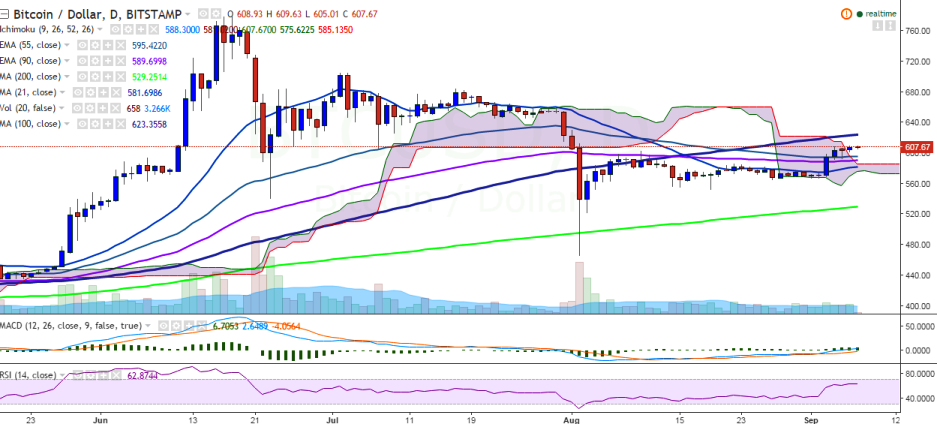
BTC/USD seems to be consolidating in a narrow range. It has hit 609.63 levels so far in the day and currently trades at 605.94 levels at the time of writing (Bitstamp).
Long-term trend: Bullish
Short-term trend: Bullish
Ichimoku analysis of daily chart:
Tenkan Sen: 588.30
Kijun Sen: 581
Trend reversal: 589.29 (90 EMA)
“The pair is trading well above 90 EMA and is targeting 620 levels. A close above the 100-day MA trend line would see further jump till 700.00 levels”, FxWirePro said in a statement.
Major resistance is seen at 622.55 (100-day MA) and a break above would see the pair reaching 653.69 (78.6% retracement of 704.99 and 465.28)/ 705 (July 3 high).
On the reverse side, support is likely to be found at 589.29 (90 EMA), and a break below would target 550/ 528.38 (200-day MA).

- News

- Economy

- Central Banks
- Investing
- Research
- Roundups
- Digital Currency
- Insights
- Technical Analysis
- Technology
- Business
- Law
- Health
- Nature
- Fintech
- Science
- Topic
- Opinions
- ©Econometrics LLC . All Rights Reserved.
BTC/USD inches closer to 100-day MA, break above targets 700
Wednesday, September 7, 2016 7:00 AM UTC
Editor's Picks


- Market Data
Most Popular


