


 FxWirePro- Major Crypto levels and bias summary
  Crypto Major Pair Action Bias: ETHUSD Bullish as BTCUSD, SOLUSD & XRPUSD Stay Neutral
  UBS Boosts China Tech Bets, Adds Kuaishou and Meituan to Focus List
  Goldman Sachs Flags 3 Key Risks Ahead of Europe’s Earnings Season
  FxWirePro: EUR/AUD bears maintain upper hand
  FxWirePro: GBP/NZD downtrend slows, but bearish sentiment remains
  Goldman AM Sees Strong Buyout Opportunities in Japan, South Korea and Australia
  FxWirePro: NZD/USD steadies around 0.5830,retains bid tone
  Goldman Sachs Raises USD/JPY Forecast, Sees Yen Weakness Persist Through 2027
  Bernstein Names IAG, Ryanair as Top European Airline Stocks Ahead of Earnings


There have been series of adverse news that’s been lingering around cryptocurrency space. Some unpleasant news has come in from Goldman Sachs last week, as a result, bitcoin prices slid to three-week’s low as Goldman Sachs Group Inc. is pulling back to defer crypto projects to set up a trading desk.
On the other hand, the US SEC has issued the order of suspension for the two XBT Provider products, namely, Bitcoin Tracker One and Ether Tracker One exchange-traded notes, issued by XBT Provider AB, a Swedish-based subsidiary of the U.K. firm CoinShares Holdings which were highly flaunted investment avenues that pursued to attract attention from the U.S. public markets investors.
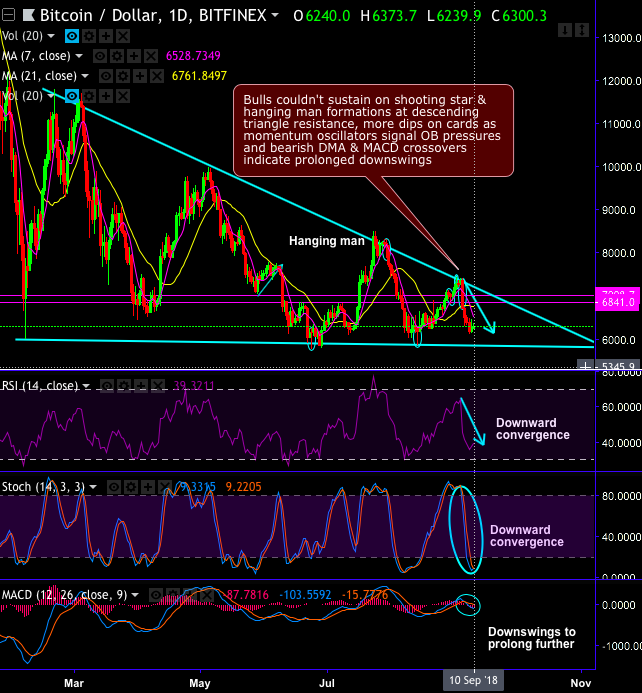
But technically, we had raised red flags for aggressive bulls in our recent posts.
Consequently, BTCUSD forms descending triangle pattern on daily terms. Although the bulls of this pair have resumed back today from the lows of $6,119.50 levels, bearish sentiments are still imminent especially after the formation of shooting star and hanging man patterns at descending triangle resistance (at $7,242.40 and $7,300 levels).
You could notice that this pair shown a considerable bearish potential as and when the formation of above-stated candlestick patterns in the past. Thereby, history has repeated this time as well since the current prices are slid below DMAs.
However, the minor bullish potential for the day cannot be ruled out. Since it costs about $6,000 to mine a bitcoin and it couldn’t exceed anything lower than that. But the real cause of concern for the short-term traders is that both momentum oscillators (RSI & stochastic curves) signal overbought pressures. We could foresee more dips on the cards in the days to come upon bearish DMA and MACD crossovers.
On an intermediate trend perspective, the pair has tested the strong support several times in the recent past at 78.6% fibonacci levels from the peaks of last december’2017 (i.e. 5701 levels) but for now, failure swings are observed at 21EMAs, the major trend wedged between 5700 - 11700 levels.
FxWirePro’s Currency Strength Index: Hourly BTC spot index is flashing -149 (which is bearish), while hourly USD spot index was at shy above -66 (bearish) at 13:26 GMT. For more details on the index, please refer below weblink:


