


 FxWirePro: EUR/ NZD steadies around 2.0150, retains bid tone
  FxWirePro- Major Pair levels and bias summary
  Ethereum Trails Bitcoin’s Retreat: Key Support Levels in Focus
  FxWirePro: EUR/ NZD loses momentum but outlook is bullish
  FxWirePro: GBP/USD recovers but bears are not done yet again
  Ethereum Reclaims $2,000 Handle: ETHUSD Stabilizes as Bulls Eye a Recovery
  FxWirePro: EUR/AUD gaining momentum for a move towards 1.6800 level
  AUDJPY Pullback Intensifies: Resistance at 110.00 Signals Short Opportunity


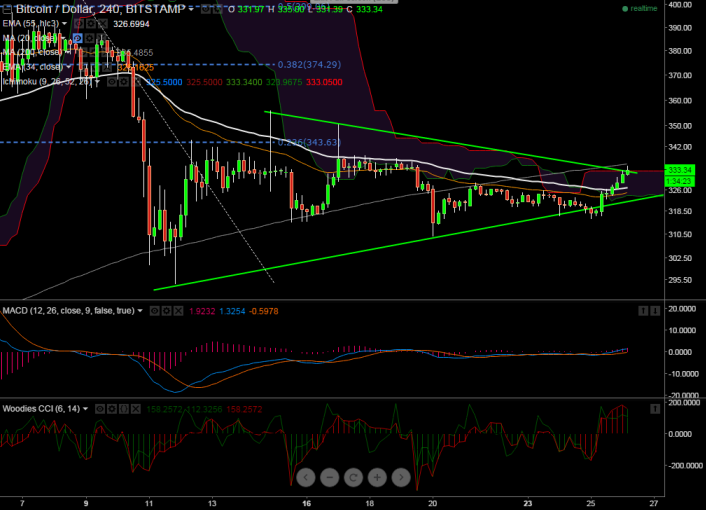
- BTC/USD has recovered from the low of $316 and jumped till $335. It is currently trading at $332
- The pair has broken minor trend line resistance $333 (trend line joining $356 and $350) but it should close above $336 (200 day 4 HMA) in 4 hour chart for further bullishness.
- Any close above $336 will take the pair to $350/$356. On the downside minor support is around $325 (55 day 4 HMA) and break below confirms minor trend reversal a decline till $316/$310 is possible.
It is good to buy at dips $331-$332 with SL around $324 for the TP of $340/$350.


