


 FxWirePro- Major Pair levels and bias summary
  Bitcoin on Edge: Geopolitical Tensions Weigh on BTC as Bulls Eye the USD 64,000 "Buy the Dip" Zone
  FxWirePro: EUR/AUD eases slightly but trend is still bullish
  FxWirePro: GBP/USD gains some upside momentum but still bearish
  FxWirePro: USD/ZAR loses momentum but outlook is bullish
  Bitcoin Retreats Toward Critical Support as Geopolitical Winds Shift
  FxWirePro: GBP/NZD uptrend loses momentum but bullish setup remains


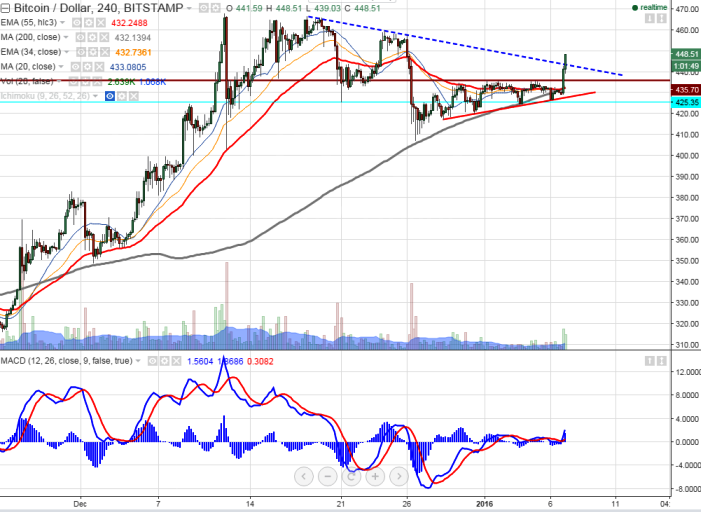
- Chart Pattern Formed- Ascending Triangle Pattern
- BTC/USD has broken major resistance $436 which confirms minor trend reversal a jump till $468 is possible.
- Short term trend is still bullish as long as support $424 holds.
- The pair's minor resistance is around $443 and any break above will take the pair to next level till $468/$480/$500 is possible. Overall trend reversal can be seen only below $400.
- On the lower side below $424 will drag the pair to next level $400/$380 .
It is good to buy at dips around $440 with SL around $424 for the TP of $468/$480/$500


