


 Ethereum Reclaims $2,000 Handle: ETHUSD Stabilizes as Bulls Eye a Recovery
  FxWirePro: USD/CNY dips as China’s yuan strengthens on Iran war de escalation hopes
  FxWirePro- Major Crypto levels and bias summary
  FxWirePro: GBP/USD gains some upside momentum but still bearish
  FxWirePro: GBP/NZD uptrend loses momentum but bullish setup remains
  FxWirePro- Major Crypto levels and bias summary
  FxWirePro: GBP/AUD runs out of steam but maintains bullish outlook
  Euro Bulls Retreat: EURUSD Faces Resistance at 1.1500 as Technical Indicators Signal Further Downside
  FxWirePro- Major Crypto levels and bias summary
  Dollar Resurgence Propels USDCHF Above 0.8000: Technicals Signal Continued Bullish Momentum Toward 0.8150
  Ethereum in Consolidation: ETH Trapped in Narrow Range as Bulls Await the USD 2,000 "Buy the Dip" Opportunity


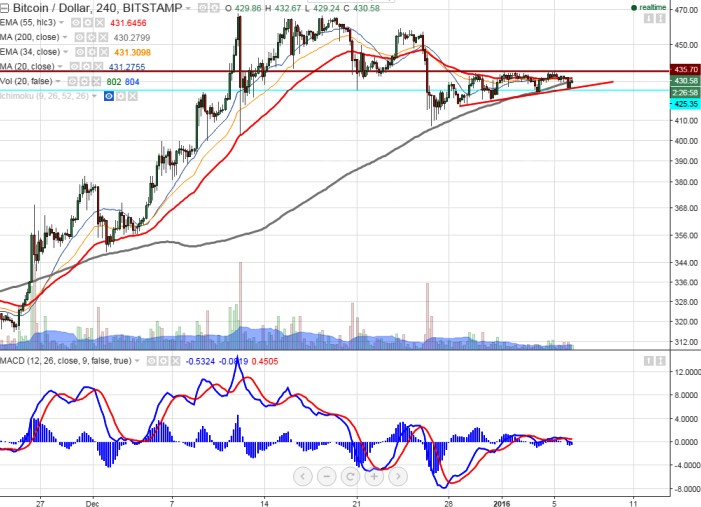
- Chart Pattern Formed- Ascending Triangle Pattern
- BTC/USD declined till $426 yesterday and recovered from that level. It is currently trading around $430.74
hort term trend is still bullish as long as support $400 holds. - The pair's minor resistance is around $436 and any break above will take the pair to next level till $480/$502 is possible. Overall trend reversal can be seen only below $400.
- On the lower side below $400 will drag the pair to next level $380/$ trend reversal only below $348.
It is good to buy at dips around $420 with SL around $400 for the TP of $465/$480


