


 FxWirePro :USD/JPY bulls loosen their grip a bit, dips to be bought
  FxWirePro- Major Pair levels and bias summary
  FxWirePro: EUR/AUD outlook weaker on renewed downside pressure
  ETH Stands Alone Bullish; BTC, SOL, XRP, BNB Neutral
  FxWirePro- Major Crypto levels and bias summary
  FxWirePro- Woodies pivot (Major)
  FxWirePro- Woodies pivot (Major)
  GBPJPY Bullish Surge: Strong Pound Ignites Fresh Upside on Fed-BOE Policy Divergence as All EMAs Align
  AUDJPY Bullish Surge: Strong Australian Dollar Fuels Fresh Upside as Pair Holds Above 113.50 and All EMAs Align


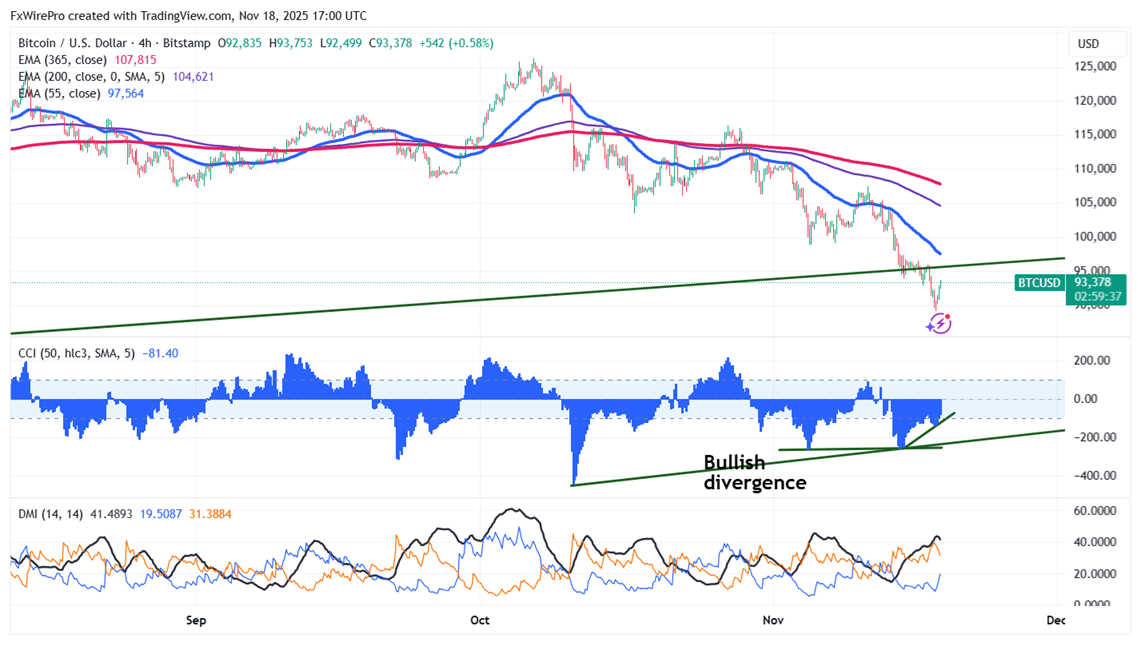
Chart pattern - Bullish divergence in CCI(50)- Both 4-hour and Daily charts.
The CCI line crosses back over the -100 level from the oversold area, confirming that the upward movement is actually taking shape.
Technical Analysis: Key Levels to Watch for BTC/USD
BTC/USD recovered after a minor decline below $90000. The pair hits an intraday high of $93753 and is currently trading around $93434.
It trades below short-term (34-EMA and 55-EMA) and long-term (200 and 365-EMA) moving averages on the 4-hour chart. Minor support is around $92800; breaking below this would drag the pair down to $89000/$86500/$80000. Immediate resistance is around $96000 indicates that closing above this level could lead to targets $10000/$105900/$108000/$115000/$120000/$126500.
Investment Strategy: Opportunities for Traders
Indicators (4-hour chart).
CCI(50)- Bearish
Directional movement index - Neutral
It is good to buy on dips around $92000 with a stop-loss set at $86500 for a TP of $115000/$120000.


