


 FxWirePro: GBP/USD under pressure despite UK's modest economic growth
  FxWirePro- Major Crypto levels and bias summary
  FxWirePro- Major Crypto levels and bias summary
  FxWirePro- Major Crypto levels and bias summary
  FxWirePro: USD/JPY uptrend loses steam, remains on bullish path
  Crypto Major Pair Action Bias: ETHUSD Bullish as BTCUSD, SOLUSD & XRPUSD Stay Neutral
  ETH Stands Alone Bullish; BTC, SOL, XRP, BNB Neutral
  FxWirePro: NZD/USD trades in narrow range ,outlook bullish


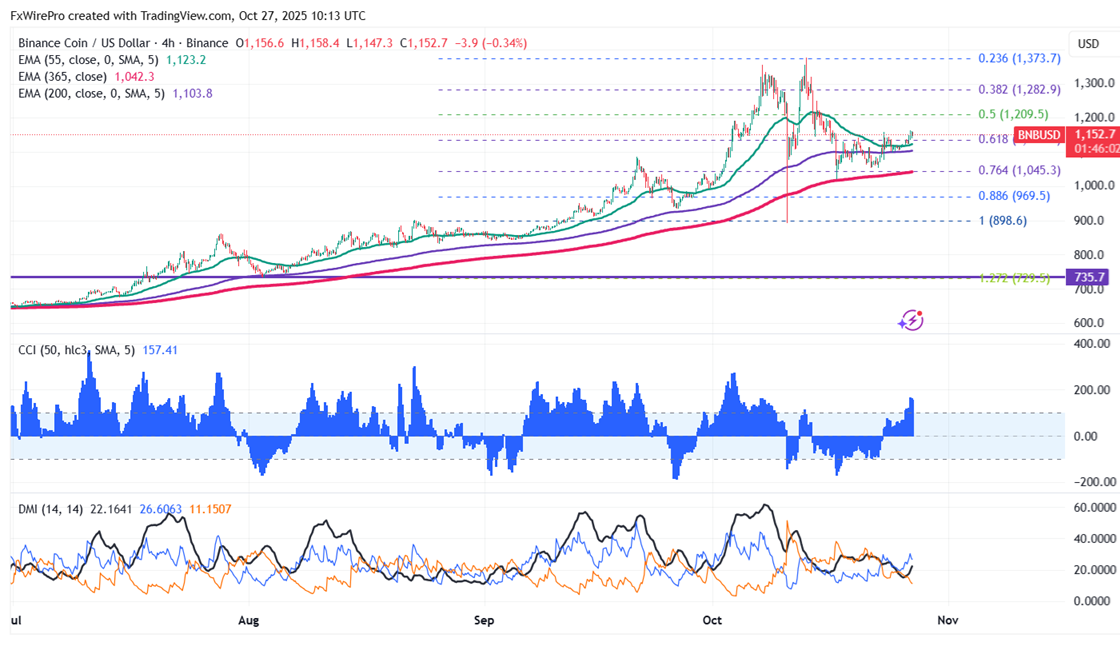
BNBUSD trades higher following the footsteps of BTC. It hits an intraday high of $1163.70 and is currently trading around $1156.3.
Oscillators and moving averages to forecast the trend of BNBUSD
CMP- $1156
EMA (4-hour chart)
55-EMA- $1122.10
200-EMA- $1103
365-EMA- $1041.70. The pair trades above short-term and long term( 365-4H and 200-4H EMA).
Major support - $1050. Any breach below $1050 will drag the pair down to $1020/$975/$930.
Major Resistance - $1175. Any break above $1175 confirms minor bullishness; a jump to $1200/$1250/$1300/$1376/$1400/$1500 is possible.
Indicators (4-hour chart)
CCI(50)- Bullish
ADX- Bullish
Investment Strategy for BNBUSD
It is good to buy on dips around $1080 with a stop loss around $1020 for target profits of $1300/$1350.


