


 FxWirePro- Major Crypto levels and bias summary
  NZDJPY Bullish Surge: Strong Kiwi Ignites Fresh Upside as 94 Support Holds and All EMAs Align
  FxWirePro- Major Crypto levels and bias summary
  FxWirePro: AUD/USD edges lower, but bullish outlook persists
  FxWirePro- Major Crypto levels and bias summary
  EUR/USD Holds Bullish Tone Despite Pullback from Yesterday’s High
  ETH Stands Alone Bullish; BTC, SOL, XRP, BNB Neutral
  AUDJPY Bullish Surge: Strong Australian Dollar Fuels Fresh Upside as Pair Holds Above 113.50 and All EMAs Align
  FxWirePro- Woodies pivot (Major)
  FxWirePro: USD/ZAR advances as South African rand weakens amid renewed Middle East tensions
  Crypto Major Pair Action Bias: ETHUSD Bullish as BTCUSD, SOLUSD & XRPUSD Stay Neutral
  GBPUSD, AUDUSD & NZDUSD Turn Extremely Bullish: Strong Positive Momentum Drives Major Pair Action Bias


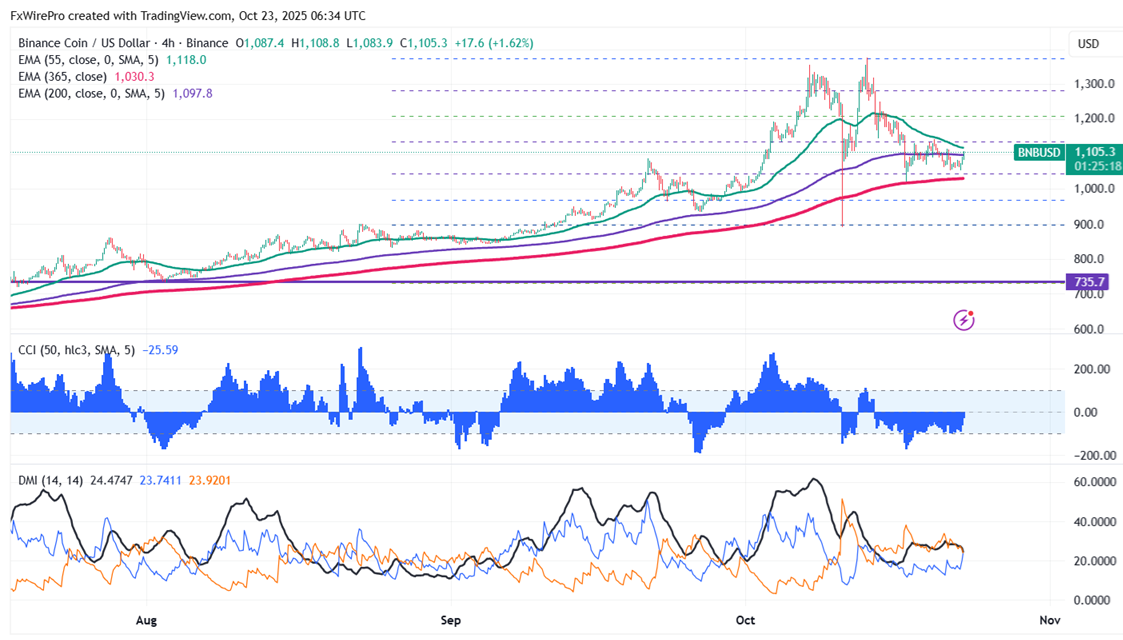
BNBUSD trades in a narrow range between $1053 and $1143 for the past three days. It hits an intraday high of $1108.80 and is currently trading around $1107.
Oscillators and moving averages to forecast the trend of BNBUSD
CMP- $1106
EMA (4-hour chart)
55-EMA- $1118
200-EMA- $1097
365-EMA- $1029. The pair trades below short-term and above 365-4H and 200-4H EMA.
Major support - $1020. Any breach below $1020 will drag the pair down to $975/$930.
Major Resistance - $1150. Any break above $1150 confirms minor bullishness; a jump to $1200/$1250/$1300/$1376/$1400/$1500 is possible.
Indicators (4-hour chart)
CCI(50)- Bearish
ADX- Neutral
Investment Strategy for BNBUSD
It is good to buy on dips around $1020 with a stop loss around $890 for target profits of $1300/$1350.


