


 FxWirePro: EUR/AUD outlook weaker on renewed downside pressure
  ETH Stands Alone Bullish; BTC, SOL, XRP, BNB Neutral
  FxWirePro: GBP/NZD gains some upside momentum but still bearish
  FxWirePro- Woodies pivot (Major)
  FxWirePro: USD/CAD falls after BoC rate hold and weak U.S. producer inflation
  FxWirePro: USD/ZAR advances as South African rand weakens amid renewed Middle East tensions
  FxWirePro- Major Crypto levels and bias summary
  FxWirePro- Major Pair levels and bias summary
  FxWirePro: GBP/USD hits one-month high, scope for further upside


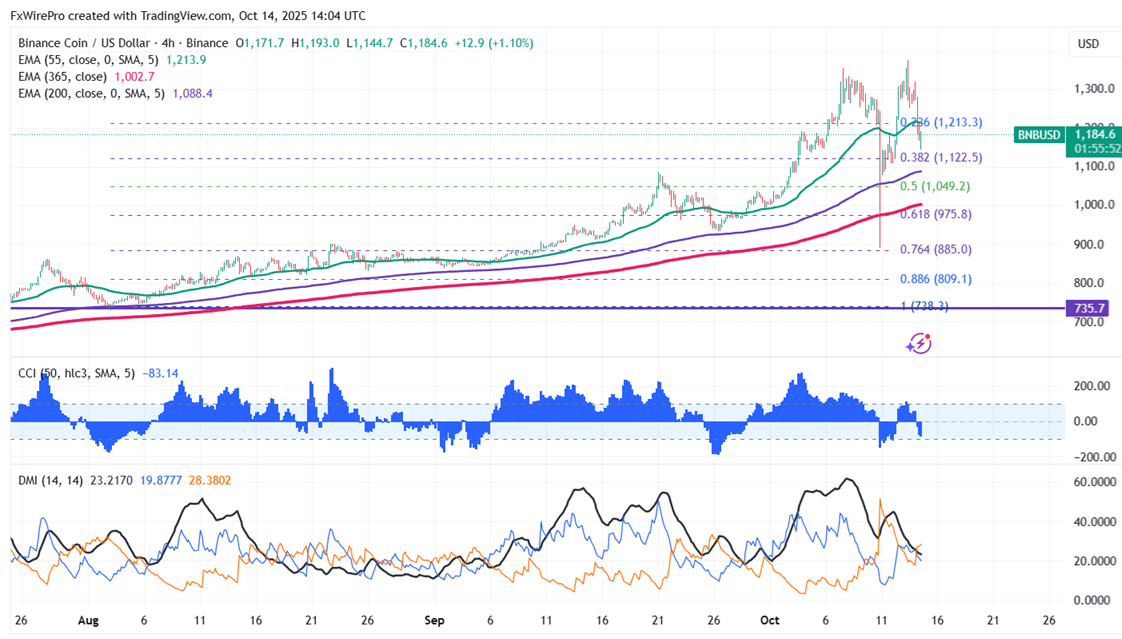
BNBUSD pared most of its gains once gain after hitting a fresh all-time high. It hit an intraday low of $1144 and is currently trading around $1182.
Oscillators and moving averages to forecast the trend of BNBUSD
CMP- $1180.8
EMA (4-hour chart)
55-EMA- $1215
200-EMA- $1087.50
365-EMA- $1001.70. The pair trades above both short-term and long-term moving averages.
Major support - $1130. Any breach below $1130 will drag the pair down to $1086/$1044/$985/$930.
Major Resistance - $1200. Any break above $1200 confirms minor bullishness; a jump to $1250/$1300/$1376/$1400/$1500 is possible.
Indicators (4-hour chart)
CCI(50)- Bearish
ADX- Neutral
Investment Strategy for BNBUSD
It is good to buy on dips around $1130 with a stop loss around $1100 for target profits of $1300/$1350.


