


 FxWirePro: USD/JPY uptrend loses steam, remains on bullish path
  FxWirePro- Woodies pivot (Major)
  Gold Loses Steam After Strong U.S. Retail Sales
  ETH Stands Alone Bullish; BTC, SOL, XRP, BNB Neutral
  FxWirePro- Major Crypto levels and bias summary
  FxWirePro: NZD/USD trades in narrow range ,outlook bullish
  FxWirePro: GBP/USD under pressure despite UK's modest economic growth
  GBPUSD, AUDUSD & NZDUSD Turn Extremely Bullish: Strong Positive Momentum Drives Major Pair Action Bias
  Crypto Major Pair Action Bias: ETHUSD Bullish as BTCUSD, SOLUSD & XRPUSD Stay Neutral
  FxWirePro- Major Crypto levels and bias summary


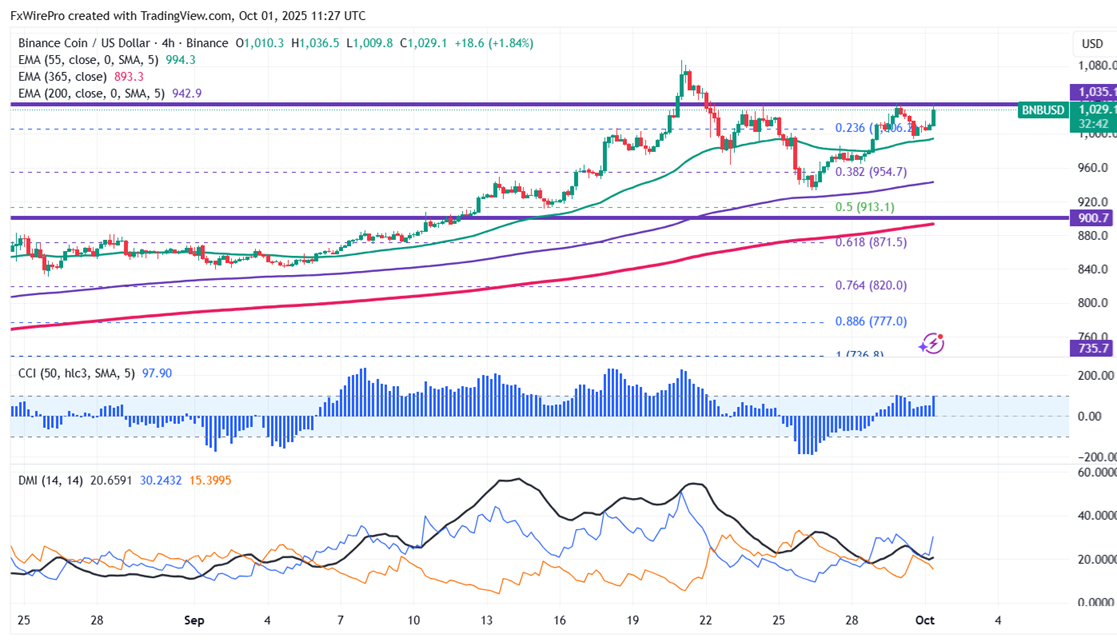
BNBUSD holds well above $1000 following the footsteps of BTC. It hits an intraday high of $1036.50 and is currently trading around $1029.10.
Oscillators and moving averages to forecast the trend of BNBUSD
CMP- $1029.10
EMA (4-hour chart)
55-EMA- $993.10
200-EMA- $942.10
365-EMA- $892. The pair trades above short and long-term moving averages.
This week's low- $993.80 (Sep 30th low). Any breach below $990 will drag the pair down to $950/$930/$889/$870/$830.
Previous week high- $1036.30 (Sep 29th high). Any break above $1036.50 confirms minor bullishness, a jump to $1051/$1087.10/$1100/$1130.
Indicators (4-hour chart)
CCI(50)- Bullish
ADX- above 20 showing bullish bias
Investment Strategy for BNBUSD
It is good to buy on dips around $980 with a stop loss around $930 for target profits of $1100.


