


 FxWirePro: AUD/USD slips on risk aversion as Middle East tensions escalate
  FxWirePro : USD/JPY holds bullish bias despite intervention concerns
  FxWirePro: USD/CNY Slips as strong PBOC fixing lifts Chinese Yuan
  FxWirePro- Major Crypto levels and bias summary
  FxWirePro: NZD/USD hits three-week high, scope for further upside
  FxWirePro: GBP/USD climbs to one-month high as dollar dips
  FxWirePro- Major Crypto levels and bias summary
  Bitcoin Pulls Back as US-Iran Tensions Stir Fresh Risk-Off Pressure


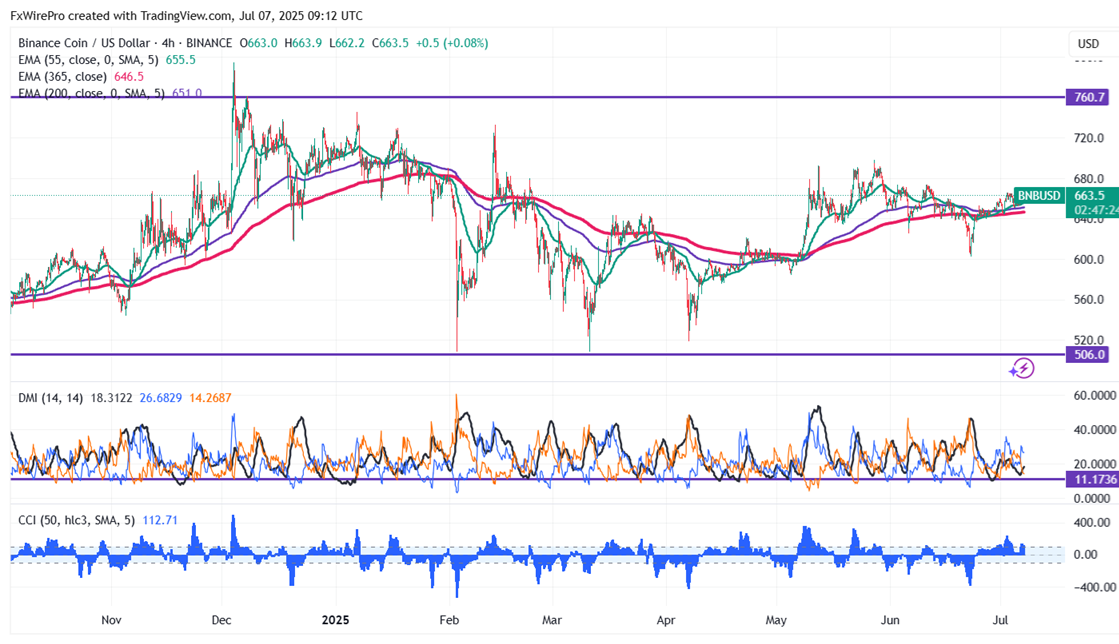
BNB/USD has been consolidating in a narrow range between $666.30 and $650.70 in the past four days. It hits an intraday high of $666.30 and is currently trading around $663.50.
Short-term trend remains bullish as long as the support $598 holds. It trades above the 55 and 34, 200 and 365 EMA on the 4-hour chart. Near-term support is around $646.40 (365- EMA), any close below targets $628/$598/$570/$520. If the pair closes below $500, potentially lead to further declines towards $400.
Immediate Resistance is at $669.Any breakout above this resistance confirms bullish momentum and a jump towards $680/$730/$800/$1000.
Indicators (4- hour Chart)
- Directional Movement Index: Bullish
- CCI (50): Bullish
Trading Strategy
It is good to buy on dips around $650 with a stop-loss set at $635 and a target price of $800/$1000.


