


 FxWirePro: AUD/USD stays defensive ahead of key U.S. inflation data
  Bitcoin Consolidates Near $78K: Will Strong ETF Inflows Trigger a Breakout to $90K?
  Major Currency Pair Scores: USD/CHF Signals Strong Bullish Momentum as NZD/USD Turns Heavily Bearish
  FxWirePro: USD/CNY sees some bounce after yesterday's fall
  FxWirePro: GBP/USD gains some upside momentum but still bearish
  AUDJPY: Bearish Outlook Despite Short-Term Bullish Signals, Sell Rallies Near 110.78
  NZDJPY: Bearish Trend Favors Selling on Rallies Above 90.18
  FxWirePro- Major Pair levels and bias summary
  FxWirePro: USD/ZAR bearish again as upside bias reverses
  FxWirePro- Major Crypto levels and bias summary


 Add as a preferred source on Google
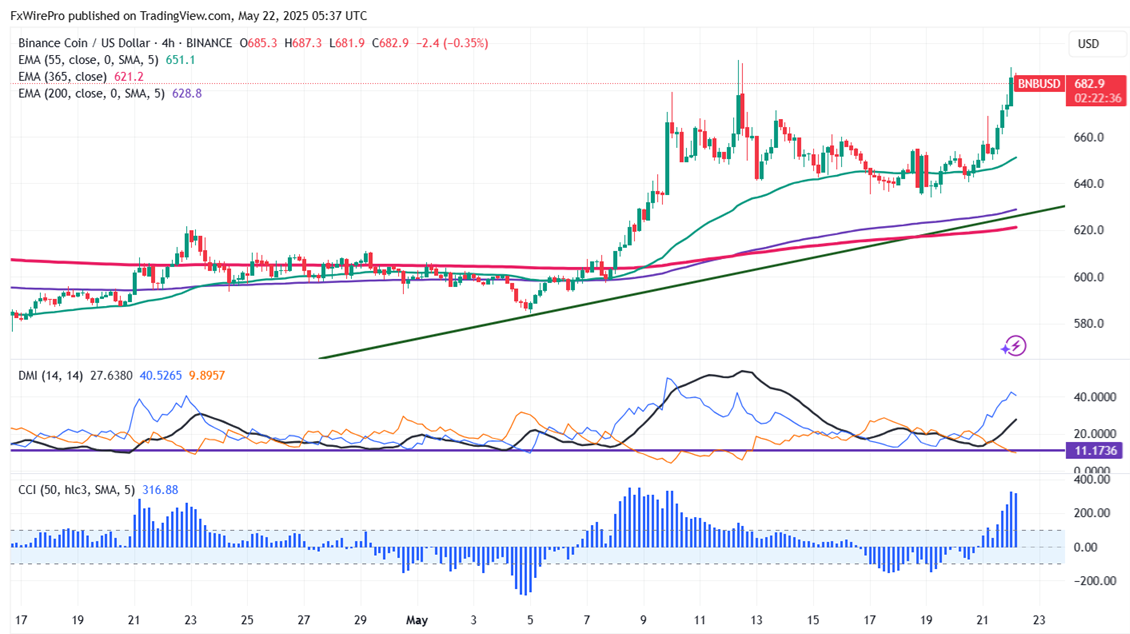
BNB/USD breaks significant resistance $680 following the footsteps of Bitcoin. It hits an high of $689 and is currently trading around $683.90.
Overall bias remains bullish as long as support of $500 holds. It trades above the 55 and 34,200 EMA on the 4-hour chart. Near-term support is around $640, any breach below targets $600/$570/$520. If the pair closes below $500, potentially leading to further declines towards $400.
Immediate Resistance is at $700. A successful breakout above this resistance could suggest bullish momentum, with further gains possible towards $730/$800/$1000.
Indicators (4-Hour Chart)
- Directional Movement Index: Bullish
- CCI (50): Bullish
Trading Strategy
It is good to buy on dips around $669 with a stop-loss set at $630 and a target price of $800/$1000.







