


 FxWirePro: USD/CAD falls after BoC rate hold and weak U.S. producer inflation
  FxWirePro- Major Crypto levels and bias summary
  FxWirePro- Major Crypto levels and bias summary
  GBPJPY Bullish Surge: Strong Pound Ignites Fresh Upside on Fed-BOE Policy Divergence as All EMAs Align
  Major Pair Action Bias: Extremely Bullish Surge Powers GBPUSD & NZDUSD as Bullish Momentum Ignites
  EUR/USD Holds Bullish Tone Despite Pullback from Yesterday’s High
  FxWirePro:EUR/NZD dips below lower range, bearish bias increases
  FxWirePro: USD/JPY uptrend loses steam, remains on bullish path
  FxWirePro: GBP/USD hits one-month high, scope for further upside


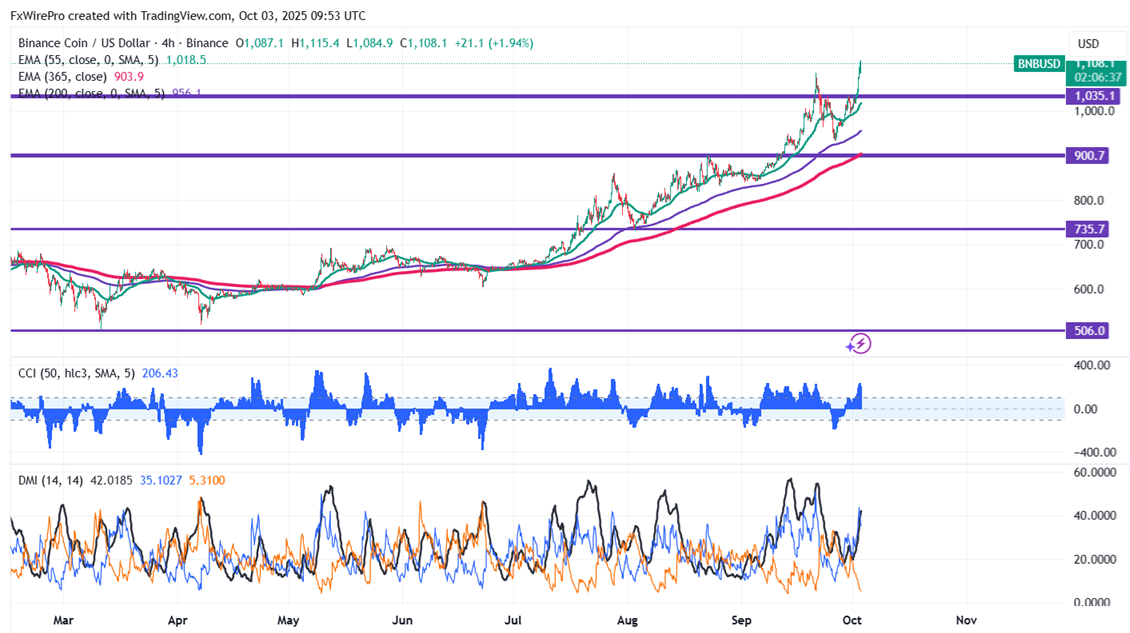
BNBUSD hits a fresh all-time high on positive developments. It hit a fresh all-time high of $1115 and is currently trading around $1109.60.
Oscillators and moving averages to forecast the trend of BNBUSD
CMP- $1109.90
EMA (4-hour chart)
55-EMA- $1015
200-EMA- $954.60
365-EMA- $902.70. The pair trades above the short and long-term moving averages.
This week week low- $993.80 (Sep 30th low). Any breach below $990 will drag the pair down to $950/$930/$889/$870/$830. Near-term support $1050.
This week high- $1115 (Oct 3rd high). Any break above $1129 (127.20% fib) confirms minor bullishness, a jump to $1183/$1200 is possible.
Indicators (4-hour chart)
CCI(50)- Bullish
ADX- above 20 showing bullish bias
5. Investment Strategy for BNBUSD
It is good to buy on dips around $980 with a stop loss around $930 for target profits of $1100.


