


 FxWirePro- Woodies pivot (Major)
  AUDJPY Bullish Surge: Strong Australian Dollar Fuels Fresh Upside as Pair Holds Above 113.50 and All EMAs Align
  FxWirePro- Major Crypto levels and bias summary
  FxWirePro: GBP/NZD gains some upside momentum but still bearish
  FxWirePro: GBP/NZD downtrend loses steam, remains on bearish path
  FxWirePro- Major Crypto levels and bias summary
  FxWirePro:EUR/NZD stuck In narrow ranges, focus on near term support
  FxWirePro: EUR/AUD neutral in the near term, scope for downward resumption
  FxWirePro: USD/JPY uptrend loses steam, remains on bullish path
  FxWirePro- Major Crypto levels and bias summary
  JPY Action Bias: CADJPY Turns Extremely Bullish While Other Pairs Hold Positive Ground
  ETH Stands Alone Bullish; BTC, SOL, XRP, BNB Neutral


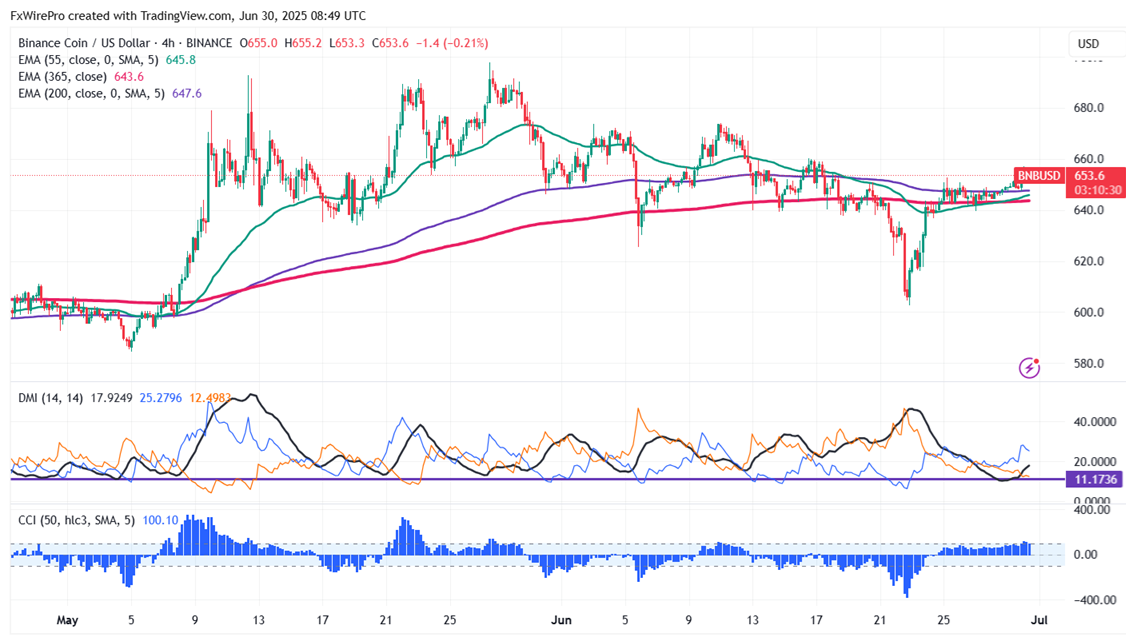
BNB/USD trades higher and surged more than $50 in the past week. It hits an intraday high of $657 and is currently trading around $653.60.
Short-term trend remains bullish as long as the support $598 holds. It trades above the 55 and 34, 200 and 365 EMA on the 4-hour chart. Near-term support is around $628 (200-EMA), any close below targets $598/$570/$520. If the pair closes below $500, potentially lead to further declines towards $400.
Immediate Resistance is at $660.Any breakout above this resistance confirms bullish momentum, and a jump could suggest bullish momentum, with further gains possible towards $669/$680/$730/$800/$1000. Near-term resistance is around $680.
Indicators (4-hour Chart)
- Directional Movement Index: Bullish
- CCI (50): Bullish
Trading Strategy
It is good to buy on dips around $625 with a stop-loss set at $595 and a target price of $800/$1000.


