


 FxWirePro: GBP/USD under pressure despite UK's modest economic growth
  EUR/USD Holds Bullish Tone Despite Pullback from Yesterday’s High
  FxWirePro: EUR/AUD outlook weaker on renewed downside pressure
  FxWirePro: USD/ZAR advances as South African rand weakens amid renewed Middle East tensions
  FxWirePro: GBP/NZD gains some upside momentum but still bearish
  JPY Action Bias: Extremely Bullish Surge Ignites Across NZD, GBP & AUD
  FxWirePro- Major Crypto levels and bias summary
  FxWirePro:EUR/NZD dips below lower range, bearish bias increases
  FxWirePro- Major Crypto levels and bias summary
  FxWirePro: USD/CAD falls after BoC rate hold and weak U.S. producer inflation


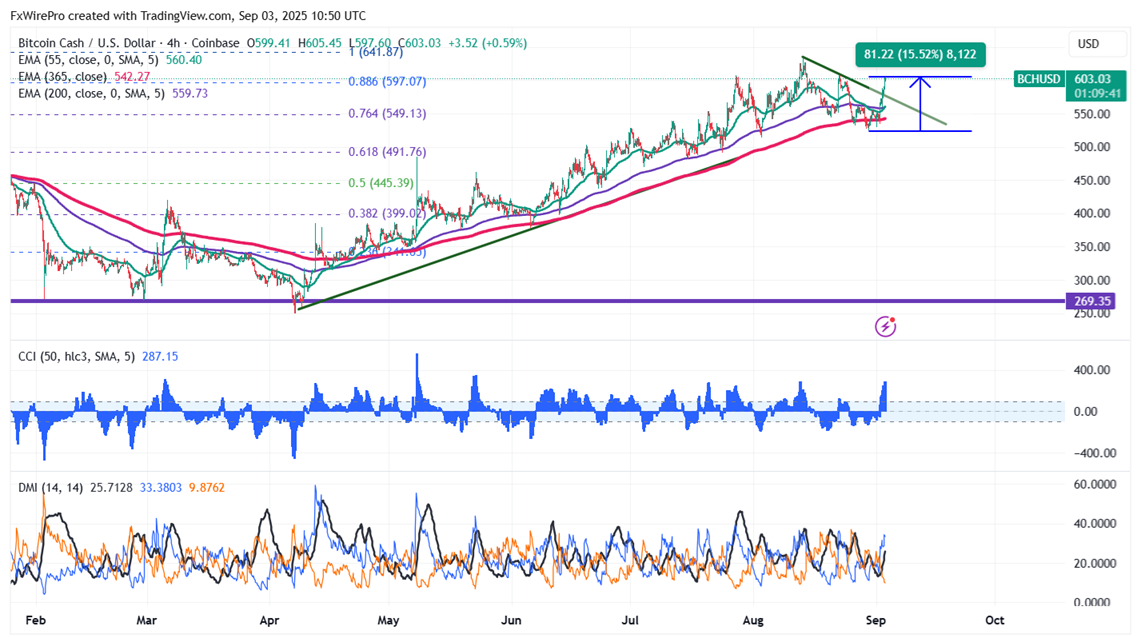
BCHUSD has broken the significant trend line resistance $580 and holds above that level. The pair surged more than 15% in the past three days. It hit a high of $604.75 and is currently trading around $602.33.The overall trend is bullish as long as the support $440 holds.
The pair holds above the short-term (34 and 55-day EMA) and above the long-term moving average (200-day EMA).
The near-term resistance is around $625; any indicative breach above will take the pair to $640/$715. On the lower side, immediate support is $559, and any violation below targets $514/$490.
Indicators (4-hour chart)
CCI(50)- Bullish
Directional movement index - Bullish
It is good to buy on dips around $559 with SL around $500 for TP of $715.


