


 Gold Pulls Back After Hitting $4,180 as Geopolitical Risk Sends Crude Higher
  Gold Surges Past $4150 on Dovish Fed Signals and Weak Jobs Data; Bullish Outlook Prevails
  JPMorgan Cuts Gold Price Forecast, Sees Bullion Reaching $4,500 by End of 2026
  Citi Raises TSMC Price Target as AI Chip Demand Strengthens Growth Outlook
  In a rebuke to Trump, the Supreme Court rules that birthright citizenship is the law of the land
  Goldman Sachs Raises USD/JPY Forecast, Sees Yen Weakness Persist Through 2027
  Bernstein Names IAG, Ryanair as Top European Airline Stocks Ahead of Earnings
  Goldman Sachs Flags 3 Key Risks Ahead of Europe’s Earnings Season
  Goldman AM Sees Strong Buyout Opportunities in Japan, South Korea and Australia
  USA at 250: the Black American struggle for life, liberty and the pursuit of happiness


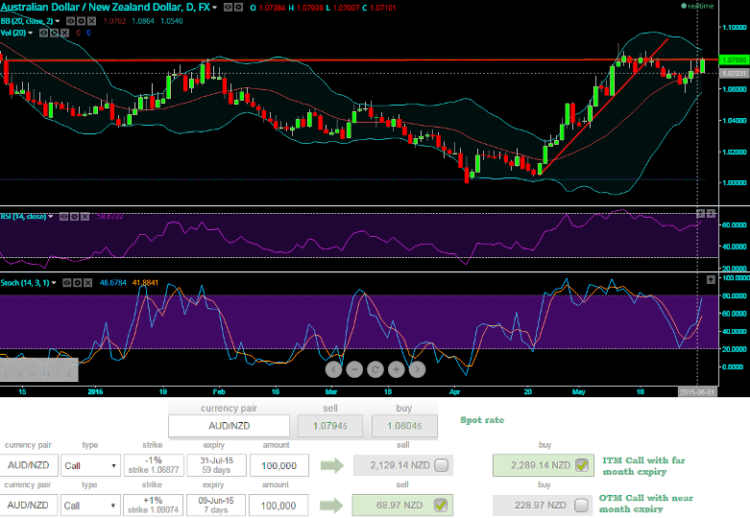
The pair is trading at 1.0789 which is crucial resistance near trend line on daily charts.
The bullish engulfing pattern candlestick occurred at the same stage to add more downward pressure to NZD.
The other oscillating indicators are also suggesting positive convergence to this upswings.
RSI (14) = trending near 64.0705 converging with price upswings.
Stochastic = %K line at 80.1762 while %D line at 57.5214 does not evidence any oversold scenes, instead signaling uptrend momentum.
We feel bullish engulfing candle with long realbody adds confirmation for uptrend of this pair that is yet to prevail.
Hence, the below recommendation can hedge the exposure in existing Bull Run.
Currency Basket: Diagonal Bull Call Spread
We advocate buying far month In-The-Money Call (strike price at 1.0687) and simultaneously writing a near month Out-Of-The-Money Call options (strike at 1.0907) of the AUD/NZD currency pair.
This strategy can be usually deployed when the hedger is bullish on the underlying pair over the longer term but is neutral to mildly bullish in the near term. That's why shorting OTM call with short term expiry benefits from time decay.
The maximum loss for the diagonal bull call spread is limited to the extent of initial premium taken to put on the spread.
This happens when the underlying currency price falls dramatically and stays down until expiration of the longer term call.

- News

- Economy

- Central Banks
- Investing
- Research
- Roundups
- Digital Currency
- Insights
- Technical Analysis
- Technology
- Business
- Law
- Health
- Nature
- Fintech
- Science
- Topic
- Opinions
- ©Econometrics LLC . All Rights Reserved.
AUD/NZD oscillating near trend line resistance; Diagonal Bull Call hedges NZD
Tuesday, June 2, 2015 7:02 AM UTC
Editor's Picks


- Market Data
Most Popular


