


 Infosys Shares Drop Amid Earnings Quality Concerns
  Why the Middle East is being left behind by global climate finance plans
  Tempus AI Stock Soars 18% After Pelosi's Investment Disclosure
  South Korea to End Short-Selling Ban as Financial Market Uncertainty Persists
  Gold Prices Rise as Markets Await Trump’s Policy Announcements
  European Stocks Rally on Chinese Growth and Mining Merger Speculation
  U.S. Banks Report Strong Q4 Profits Amid Investment Banking Surge
  Reliance Industries Surges on Strong Quarterly Profit, Retail Recovery


On 23 February – the eve of Russia’s invasion of Ukraine – the Council of the European Union (EU) adopted the first package of sanctions in response to Moscow’s recognition of the self-proclaimed autonomous republics of Donetsk and Lugansk.
Five more packages followed, the last of which was adopted on 3 June. From the second package onwards, sanctions targeted trade in goods. Let’s go over the sanctions’ timeline to better assess their effects.
-
On 25 February, the Council banned exports of so-called “dual-use goods” – designed for civilian use but likely to be repurposed for military ends. Their list is long, covering chemicals, special metal alloys, protection against chemical and biological agents… but also spare parts for aeronautics and goods for use by Russian refineries.
-
On 9 March, exports of certain maritime navigation and radio communication equipment were banned.
-
On 15 March, the list went on to incorporate luxury goods exports. The fourth package was also the first to introduce bans on imports of specific goods. Imports of types of steel and aluminium products, which were already targeted by safeguard measures (i.e., limitations on the quantities imported), were halted altogether.
-
Adopted on 8 April, the fifth package begins to set the tone for the ban on Russian imports, covering coal, cement, rubber products, wood, selected alcoholic beverages and fishery products.
-
The sixth package, which is set to ban 90% of oil imports from Russia by the end of 2022, was adopted on 3 June. From that point onwards, trade sanctions will become massive (Figure 1): by the end of the year, 65% of EU imports from Russia will be banned, compared to only 10% after the fifth package in April 2022.
Figure 1: Share of EU imports from Russia affected by sanctions: the last three packages
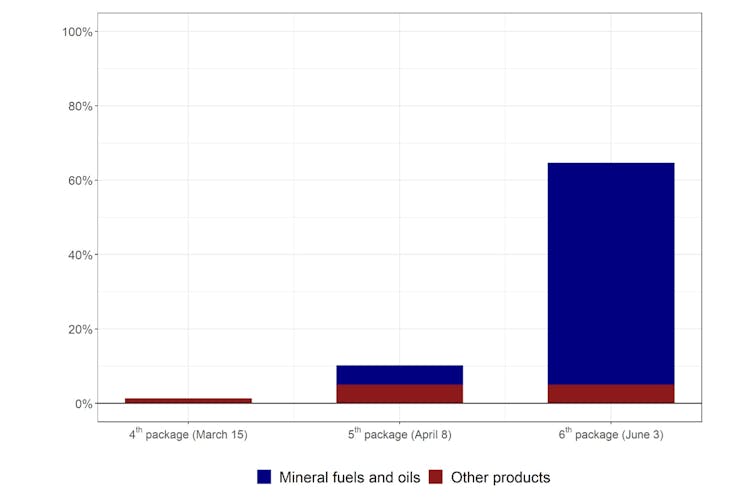
Notes: Each package includes the previous sanctions. Thus, the last bar covers all imports banned since the fourth package. Mineral fuels and oils include restrictions on coal and oil. Authors’ calculations based on CEPII, BACI database
65% of imports from Russia are banned
As Matthieu Crozet and Julian Hinz point out, “trade embargo is the weapon of the powerful”. Clearly, the larger the sanctioning country, the higher the costs it inflicts on the sanctioned country, which loses both a key supplier and important markets. Conversely, for the country imposing the embargo, the costs will be all the higher the larger the targeted country.
In 2021, Russia was the EU’s fifth largest trading partner, accounting for almost 6% of European trade with the world. The amounts involved are considerable: €258 billion, of which €159 billion are EU imports.
Since the fifth package, trade sanctions on Russian imports have covered 10% of Russian goods crossing the EU border, equivalent to €14-17 billion of trade (these figures are calculated based on 2019 trade data, in a bid to avoid incorporating the effects from the Covid-19 crisis). Once the sixth package has become fully effective at the end of the year, that figure will have risen to 65%.
Such shares are significant, as are their expected negative impacts. Nevertheless, the EU enjoys two advantages over Russia: its significant trade integration and its economic clout. Indeed, while European sanctions (including the sixth package) cover 25% of total Russian exports, they represent only 5% of EU imports. The asymmetry is large. In other words, Russian trade is more dependent on European buyers than European trade is on Russian suppliers.
Yet the aggregate figures hide strong disparities between sectors. For example, in the wood sector, the sanctions already in place apply to all European imports from Russia (figure 2); in the energy sector (mineral fuels and oils), 78% of imports from Russia will be banned by the end of the year, an increase of over 71% compared to the fifth package. In contrast, the share of banned aluminium imports is ten times lower, at around 8%.
Figure 2: Share of EU imports from Russia banned by sanctions (by sector)
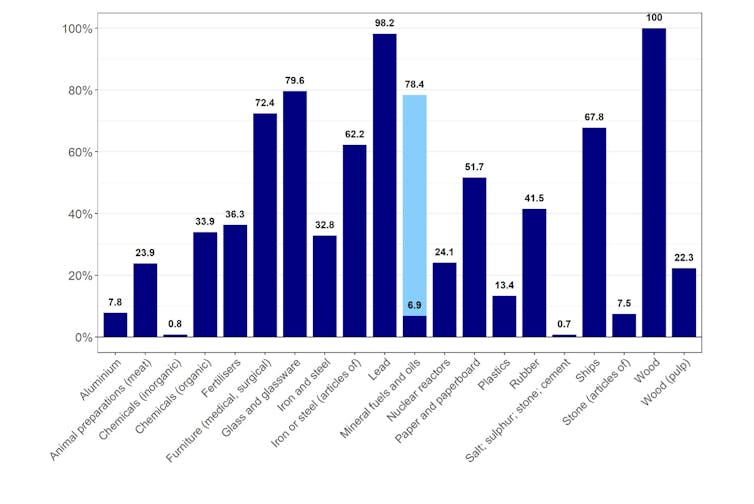
In the fertilisers sector, sanctions cover 36.3% of EU imports from Russia. The light blue bar represents the additional impact of the sixth package. The sanctions also apply to silver in the precious metals sector. However, the product represents only 0.005% of imports in the sector. For the sake of clarity, the sector is excluded from the graph. Authors’ calculations based on CEPII, BACI database
The high impact on some sectors can weaken European production chains. European importers are most dependent on Russian products in the energy and fertiliser sectors. More than 40% of coal and fertilisers are covered by sanctions, while 30% of oil is imported from Russia. These goods have the common characteristic of entering production chains at an early stage.
Thus, a disruption in their supply could result in production drops in European sectors exploiting these goods, potentially inflicting higher costs than the initial sanctions. The magnitude of such a “snowball effect” lies at the core of the current debate over the potential impact of oil and natural gas sanctions. The estimated repercussion depends, on the one hand, on the ease of identifying alternative suppliers of banned goods and, on the other hand, on the possibility of substituting them with similar products.
Figure 3: Russia’s share in EU imports of products covered by sanctions (by sector)
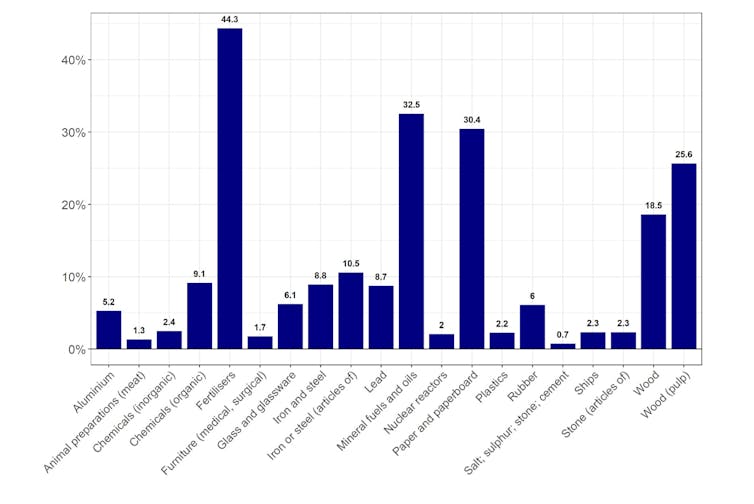
For products covered by sanctions in the fertilisers sector, 44.3% of EU imports come from Russia. Sanctions also cover silver in the precious metals sector. However, Russia accounts for only 0.02% of imports of this product. For the sake of clarity, the sector is excluded from the graph. Authors’ calculations based on CEPII, BACI database
The import bans will therefore force companies to adapt, either by seeking alternative sources to banned products, or by replacing them with other comparable goods. Although such coping mechanisms might ensure production in affected sectors does not come to a complete halt, they will generate additional costs. Some of them will be absorbed by profit margins and some will be passed onto consumers through higher prices. The question remains of how easily firms can find alternative suppliers. This issue can be very technical.
Replacing Russian imports in Europe
To take the example of fertilisers, EU sanctions cover potassium chloride, but also fertilisers that include all three key chemical elements in agronomy, namely potassium, nitrogen and phosphates. Russia supplies a large share (44%) of EU imports of these products (Figure 3). Canada is the world’s largest producer and exporter of potassium fertilisers, far ahead of Russia, but it produces almost no phosphate fertilisers and exports little nitrogen fertiliser. Thus, Canada could replace Russia mainly for the supply of potassium-based fertilisers. However, production cannot increase instantly – the market will be tight in 2022.
The same logic applies to import restrictions on mineral fuels. Almost a third of the EU’s coal and oil imports come from Russia. For oil, Russia is the EU’s largest supplier, followed by a large margin by Norway, Kazakhstan and the United States, each respectively accounting for 8% of market share. Reconsidering its initial stance, the Organization of Petroleum Exporting Countries and Russia (OPEC+) announced on 2 June they would increase supply by about 1.5% starting next July.
This increase represents only around 25% of the oil that the EU will no longer import from Russia. Hence, a game of “musical chairs” on the oil market is likely to take place: Russian production would go to Asian countries, thus freeing up some OPEC+ exports, which would be redirected to the EU.
Moreover, European imports may also be limited by Russian retaliation measures targeting products in which Russia has a dominant position. This is what happened with the interruption of gas supplies to some EU countries. As a result of the sixth package of EU sanctions, other countries and products could now also be targeted. But, as underlined by the French President, faced with Russia’s choice to continue its war in Ukraine, it is difficult not to react “as Europeans, united and in solidarity with the Ukrainian people”.


