


 Gold Prices Fall Amid Rate Jitters; Copper Steady as China Stimulus Eyed
  FxWirePro: Daily Commodity Tracker - 21st March, 2022


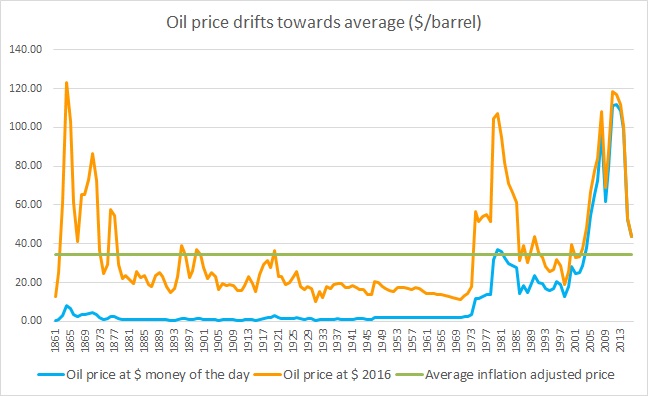
The price of oil is in recovery mode this week, after five weeks of consecutive decline. The North American benchmark WTI is currently trading at 445 per barrel and the North Sea benchmark Brent at $2.5 per barrel premium to WTI. However, we believe that the price would remain under pressure thanks to the existing supply glut in the market. This chart, which includes 255 years of oil price, especially since the days of the initial discoveries suggest that despite the above $100 price in recent years, the average price (adjusted to dollar money of 2016) remains low around $34.6 per barrel and the price might be drifting there.
The chart shows that after initial discovery as the demand skyrocketed, oil price (adjusted to the dollar of 2016) reached as high as $123.2 per barrel. As the supply increased, oil price remained close to its average until 1970’s when a series of events in the Middle East, including an oil embargo on the United States pushed prices above $100 per barrel. As the tensions subsided and supply increased, the price of oil once again declined below its long-term average by 90’s. The latest upside leg began in 2001, when increased demand from the US, Europe thanks to globalization pushed prices higher and ultimately reached above $100. The latest downside leg began by the end of 2013 and we believe that if history is any guide, the price is heading towards its long-time average.


