


 FxWirePro: GBP/USD advance after softer US inflation dims Fed rate hike bets
  FxWirePro: GBP/USD hits one-month high, scope for further upside
  FxWirePro: EUR/AUD bears maintain upper hand
  GBPJPY Bullish on Consolidation: Holds Above 216 After 218 Top – Buy Dips at 217 Targeting 220
  FxWirePro: NZD/USD trades in narrow range ,outlook bullish
  FxWirePro :USD/JPY bulls loosen their grip a bit, dips to be bought
  FxWirePro: GBP/NZD downtrend slows, but bearish sentiment remains
  FxWirePro: AUD/USD remains buoyant, looks to extend gains
  AUDJPY Extremely Bullish Above 113: Strong AUD Fuels Fresh Rally – Buy Dips at 113 Targeting 115
  Major JPY Action Bias — Extremely Bullish Setups in NZD/JPY, AUD/JPY and CAD/JPY
  FxWirePro: AUD/USD edges lower, but bullish outlook persists
  FxWirePro- Woodies pivot (Major)
  FxWirePro- Major Pair levels and bias summary
  FxWirePro:EUR/NZD dips below lower range, bearish bias increases
  FxWirePro: USD/JPY uptrend loses steam, remains on bullish path
  FxWirePro- Major Pair levels and bias summary


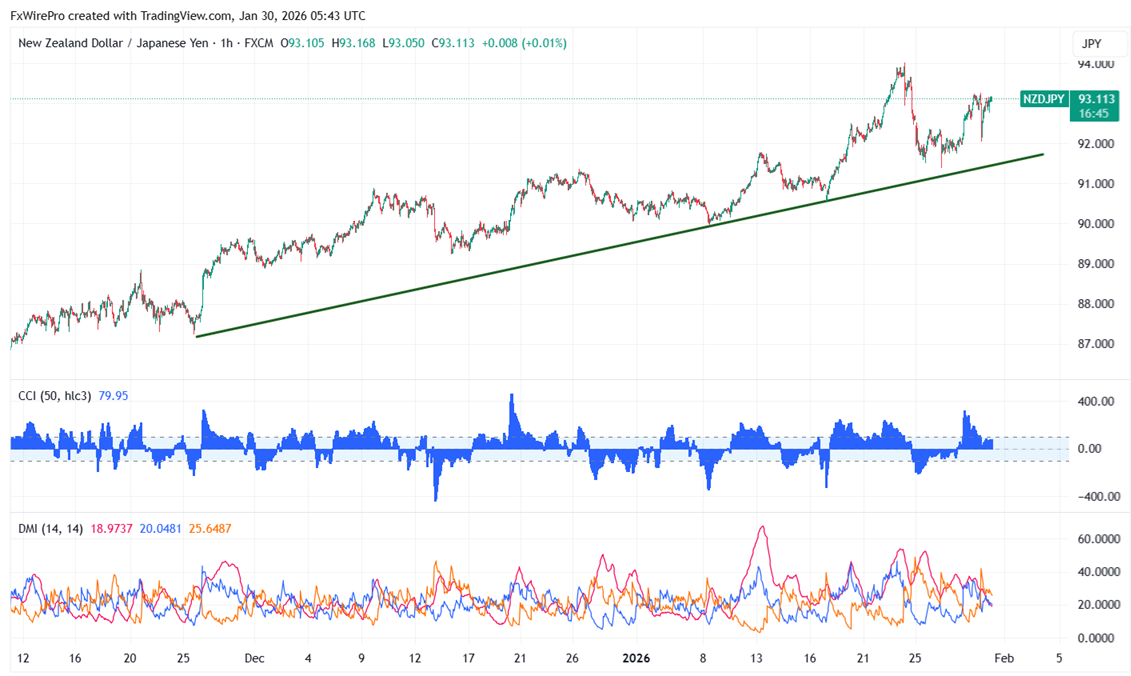
For the last three days, the NZDJPY is trading in a tight band between 91.38 and 93.26. If the 91.40 support level holds, the short-term trend seems to be favorable. Earlier, the pair leaped to 93.26; but, it is presently trading around 93.09.
Oscillators and moving averages to forecast the trend of NZDJPY
CMP- 93.09
EMA (1-hour chart)
55-EMA- 92.72
200-EMA- 92.34
365-EMA- 91.96. The pair trades above the short (55 EMA) and long-term moving average 200 and above 365).
Major support- 92.50. Any breach below will drag the pair down to 92/91.40/90.85/90.45/89.70.
Major resistance - 93.67. Any break above 93.50 confirms minor bullishness, a jump to 94/95/96.
Indicator (1- hour chart)
CCI (50)- bullish
Average directional movement Index- Neutral. All indicators confirm a neutral trend.
It is good to buy on dips around 92.48-50 with SL around 91.40 for the TP of 95.


