


 FxWirePro:EUR/NZD stuck In narrow ranges, focus on near term support
  FxWirePro- Major Pair levels and bias summary
  FxWirePro: GBP/NZD downtrend loses steam, remains on bearish path
  Gold Loses Steam After Strong U.S. Retail Sales
  FxWirePro: USD/ZAR advances as South African rand weakens amid renewed Middle East tensions
  FxWirePro- Woodies pivot (Major)
  FxWirePro- Major Crypto levels and bias summary
  NZDJPY Bullish Surge: Strong Kiwi Ignites Fresh Upside as 94 Support Holds and All EMAs Align
  FxWirePro: GBP/USD hits one-month high, scope for further upside
  FxWirePro- Major Pair levels and bias summary
  FxWirePro: EUR/AUD neutral in the near term, scope for downward resumption
  ETH Stands Alone Bullish; BTC, SOL, XRP, BNB Neutral
  EUR/USD Holds Bullish Tone Despite Pullback from Yesterday’s High
  JPY Action Bias: Extremely Bullish Surge Ignites Across NZD, GBP & AUD
  FxWirePro: NZD/USD trades in narrow range ,outlook bullish


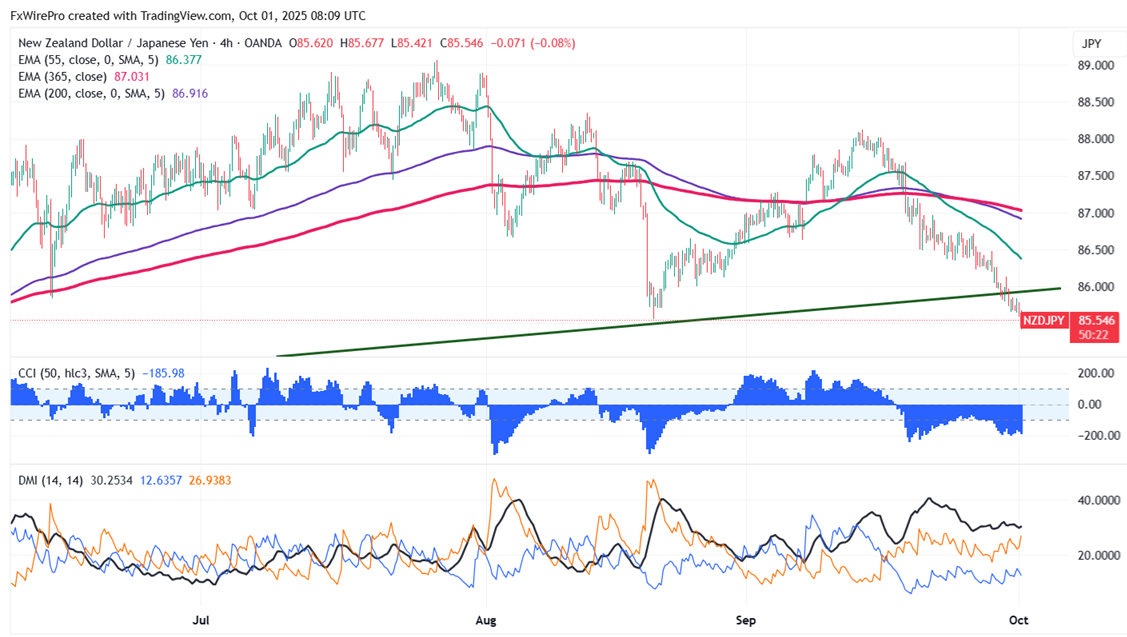
NZDJPY is declining after forming a temporary top around 88.12 for the past week. Intraday trend remains bearish as long as the resistance at 86.50 holds. Hitting an intraday low of 85.48, it presently trades at about 85.53. As long as the resistance at 89.20 remains intact, the general bearish trend is still valid.
Oscillators and moving averages to forecast the trend of NZDJPY
CMP- $85.61
EMA (4-hour chart)
55-EMA- $86.39
200-EMA- $86.91
365-EMA- $87.02. The pair trades below the short and long-term moving averages.
Previous week low- $86.21 (Sep 26th low). The pair trades well below the previous week's low. Any breach below $85.50 will drag the pair down to 84.59/83.
Previous week high- 86.96(Sep 22nd high). Any break above $86.96 confirms minor bullishness, a jump to 88/88.50.
Technicals-
The pair is trading below the 55 EMA, 200 EMA, and 365 EMA in the 4-hour chart.
The near-term resistance is around 86.75, breach above targets 87/87.40/89.20/90. The immediate support is at 85.75; any violation below will drag the pair to 85.50/85.10/84.06.
Indicator (4-hour chart)
CCI (50)- Bearish
Average directional movement Index- Neutral. All indicators confirm a mixed trend.
It is good to sell on rallies around 86.28-30 with SL around 86.75 for TP of 85.


