


 Citi Raises TSMC Price Target as AI Chip Demand Strengthens Growth Outlook
  Goldman AM Sees Strong Buyout Opportunities in Japan, South Korea and Australia
  JPMorgan Cuts Gold Price Forecast, Sees Bullion Reaching $4,500 by End of 2026
  State of emergency in Crimea as Ukraine focuses pressure on ‘jewel in Putin’s crown’
  In a rebuke to Trump, the Supreme Court rules that birthright citizenship is the law of the land
  Goldman Sachs Flags 3 Key Risks Ahead of Europe’s Earnings Season
  Bank of America Upgrades T-Mobile to Buy, Says LEO Satellite Fears Are Overdone
  Bernstein Names IAG, Ryanair as Top European Airline Stocks Ahead of Earnings
  Gold Pulls Back After Hitting $4,180 as Geopolitical Risk Sends Crude Higher


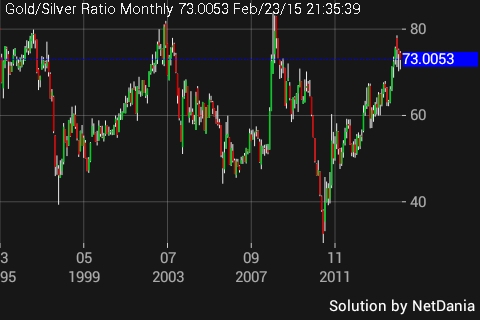
The performance of the gold silver ratio is presented in the chart since 1996.
Analogy-
- Over the last two decade this is the fourth time the ratio has reached such levels. The ratio is currently trading at 73 falling from just below 80.
- If history is of any guide we can expect silver to glitter more compared to Gold in the coming quarters.
- Usually when the ratio falls, the precious commodities do well. We could also expect better days ahead of the pact.
- So far in an environment of low inflation and fall in volatility, gold has lost its shine. It is expected that it might see better days ahead.
Gold seems to be strong over the medium term currently the bulls are fighting the bears at a rising support level of 1190-1200. Gold is still off its lows of sub 1150.







