


 FxWirePro: USD/JPY uptrend loses steam, remains on bullish path
  FxWirePro: NZD/USD steadies around 0.5830,retains bid tone
  JPY Action Bias: Extremely Bullish Surge Ignites Across NZD, GBP & AUD
  FxWirePro:EUR/NZD extends fall, key support lies ahead
  EUR/USD Holds Bullish Tone Despite Pullback from Yesterday’s High
  FxWirePro: EUR/AUD bears maintain upper hand
  FxWirePro: AUD/USD edges lower, but bullish outlook persists
  FxWirePro- Woodies pivot (Major)
  NZDJPY Bullish Surge: Strong Kiwi Ignites Fresh Upside as 94 Support Holds and All EMAs Align
  FxWirePro: AUD/USD remains buoyant, looks to extend gains
  FxWirePro:EUR/NZD dips below lower range, bearish bias increases
  FxWirePro- Major Crypto levels and bias summary
  FxWirePro: USD/CAD falls after BoC rate hold and weak U.S. producer inflation
  FxWirePro: GBP/USD hits one-month high, scope for further upside
  AUDJPY Bullish Surge: Strong Australian Dollar Fuels Fresh Upside as Pair Holds Above 113.50 and All EMAs Align


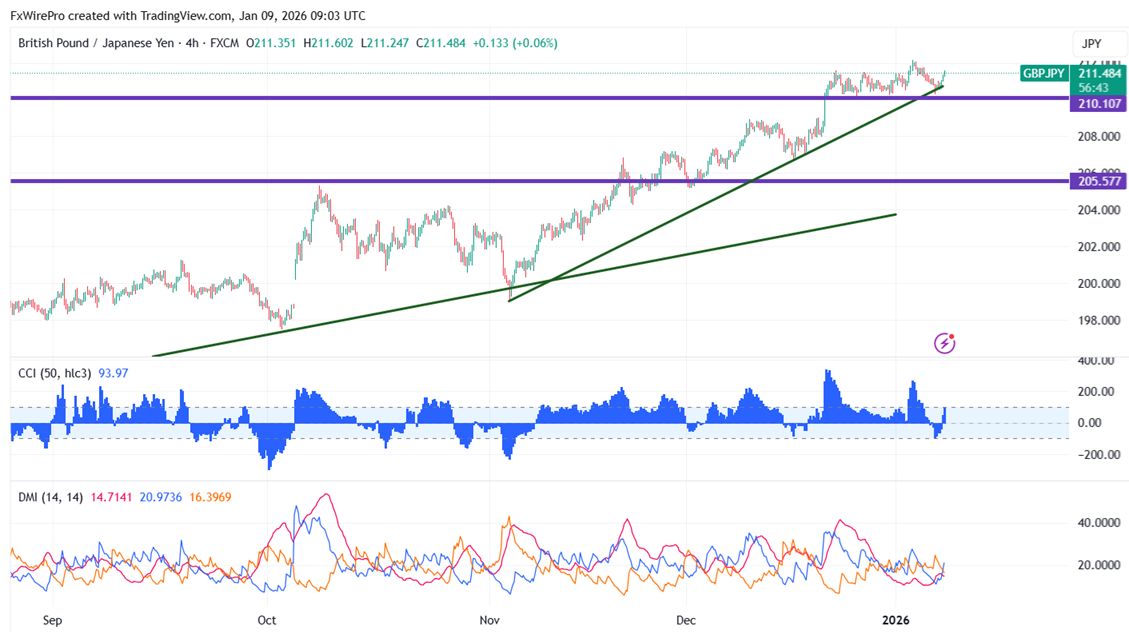
GBPJPY took support near the trend line and showed a nice pullback. As long as support 210 holds, the intraday trend is neutral. Any violation below 210 confirms further intraday weakness. It is trading around 211.41, as of publication, and has reached an intraday high of 211.60.
Oscillators and moving averages to forecast the trend of GBPJPY
CMP- 211.41
EMA (1-hour chart)
55-EMA- 211.21
200-EMA- 210.95
365-EMA- 210.30. The pair trades below the short (55- EMA) and above the long-term moving average(365 EMA and below 200 EMA).
Major Support- 210. Any breach below will drag the pair down 209.70/209/208.60/207.95/207.20/206.75.
Major resistance - 212.20. Any break above confirms minor bullishness; a jump to 212.60/213/214 is possible.
Indicator (4-hour chart)
CCI (50)- Bearish
Average directional movement Index- Bearish. All indicators confirm a bearish trend.
It is good to buy on dips around 211 with SL around 210 for a TP of 213/214.


