


 EUR/USD Holds Bullish Tone Despite Pullback from Yesterday’s High
  FxWirePro :USD/JPY bulls loosen their grip a bit, dips to be bought
  FxWirePro: EUR/AUD bears maintain upper hand
  JPY Action Bias: Extremely Bullish Surge Ignites Across NZD, GBP & AUD
  FxWirePro: EUR/AUD outlook weaker on renewed downside pressure
  Crypto Major Pair Action Bias: ETHUSD Bullish as BTCUSD, SOLUSD & XRPUSD Stay Neutral
  GBPUSD, AUDUSD & NZDUSD Turn Extremely Bullish: Strong Positive Momentum Drives Major Pair Action Bias
  FxWirePro: AUD/USD edges lower, but bullish outlook persists
  FxWirePro- Major Pair levels and bias summary
  FxWirePro- Woodies pivot (Major)
  FxWirePro: USD/CAD falls after BoC rate hold and weak U.S. producer inflation
  FxWirePro: GBP/NZD gains some upside momentum but still bearish
  FxWirePro- Major Crypto levels and bias summary
  GBPJPY Bullish on Consolidation: Holds Above 216 After 218 Top – Buy Dips at 217 Targeting 220
  NZDJPY Extremely Bullish Above 94: Broad NZD Buying Fuels Fresh Upside – Buy Dips at 93.70 Targeting 95
  FxWirePro: GBP/USD hits one-month high, scope for further upside


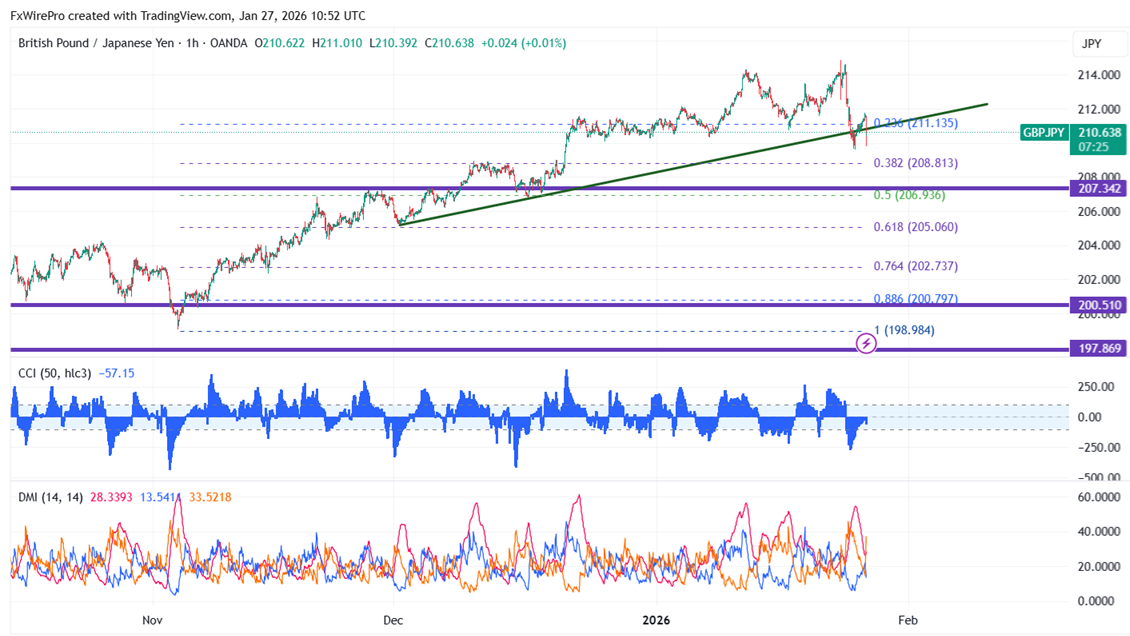
GBPJPY declined sharply on board-based yen strength. The intraday trend is bearish as long as the resistance at 212 holds. As of publishing, it is trading around 210.86; its intraday low is 209.77.
Oscillators and moving averages to forecast the trend of GBPJPY
CMP- 210.63
EMA ( 15-min chart)
55-EMA- 211.52
200-EMA- 211.20
365-EMA- 211.89. The pair trades below the short (55- EMA) and long-term moving average (200 and 365 EMA).
Major Support- 209.80. Any breach below will drag the pair down to 208.50/208 .
Major resistance - 212. Any break above 212 confirms minor bullishness; a jump to 213.45/215 is possible.
Indicator (15-min chart)
CCI (50)- Bearish
Average directional movement Index- Neutral. All indicators confirm a mixed trend.
It is good to sell on rallies around 211 with SL around 212 for a TP of 208.


