


 FxWirePro: USD/JPY eases ahead of Fed decision , Intervention risks linger
  FxWirePro: USD/ZAR retreats but trend is still bullish
  Major Pairs Action Bias: USDCAD and USDCHF Stand Out as Extremely Bullish While GBPUSD and NZDUSD Turn Extremely Bearish
  FxWirePro: AUD/USD falls after softer-than-expected Australian Q2 CPI
  FxWirePro: AUD/USD dips after RBA Governor speech
  JPY Pairs Action Bias: EURJPY Leads as Bullish Standout Amid Mixed Momentum
  FxWirePro: GBP/NZD gains some ground but bias is still bearish
  FxWirePro: NZD/USD edges lower, remains on back foot
  FxWirePro- Major Pair levels and bias summary
  FxWirePro: GBP/NZD maintains bersish bias with focus on 2.2900 level
  AUDJPY Weakness Deepens: Sell Rallies Toward 112 as Aussie Dollar Falters
  EUR/JPY Holds Bullish Bias as Euro Extends Recovery
  FxWirePro: NZD/USD neutral in the near-term, scope for downward resumption
  FxWirePro: EUR/NZD up trend gains momentum but hurdles ahead
  NZDJPY Pullback: Sell Rallies Toward 93.30 as Yen Weakness Eases


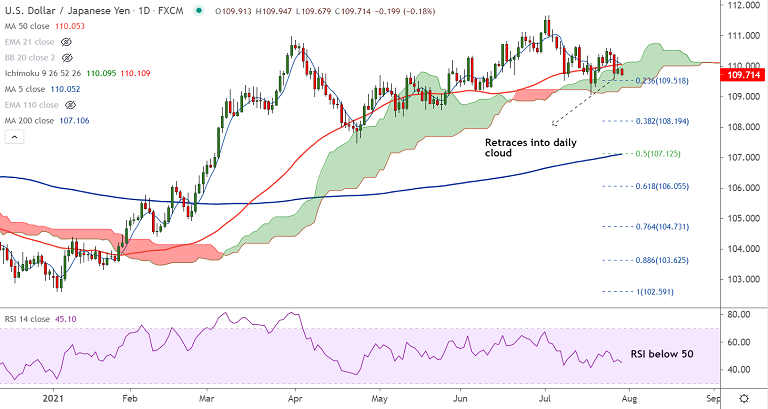
USD/JPY chart - Trading View
Spot Analysis:
USD/JPY was trading 0.15% lower on the day at 109.75 at around 05:20 GMT
Previous Week's High/ Low: 110.59/ 109.06
Previous Session's High/ Low: 110.28/ 109.72
Fundamental Overview:
US dollar tracked the US Treasury yields and remained under pressure, dragging the pair lower on Thursday.
The US Dollar Index (DXY), remained on the backfoot amid falling US Treasury yields, extends weakness for the 4th straight session.
The Fed at its latest monetary policy’s meeting left the target range for its federal rates unchanged at 0-0.25%.
The assets purchasing also remained unchanged at the current pace of $120 billion. Tug-of-war between growth and inflationary concerns took a toll on Fed’s decision.
Fed Chair Jerome Powell cautioned that although there has been substantial improvement in the economy still there is a way to go before the central bank would adjust its ultra-accommodative policy.
Dollar erased gains after the Fed decision and on Powell’s dovish comments. DXY was down 0.13% at 92.14 at the time of writing.
Investors now await US Core Personal Consumption Expenditure (PCE), Gross Domestic Product (GDP) and Weekly Initial Jobless Claims data for further impetus.
Technical Analysis:
- USD/JPY extends weakness below 110 handle
- GMMA indicator on the intraday charts shows major and minor trend are bearish
- Stochs and RSI are biased lower, RSI has slipped below 50 mark
- MACD is below zero, price has slipped into cloud, chikou span is biased lower
Major Support and Resistance Levels:
Support - 109.51 (23.6% Fib), Resistance - 110.02 (200H MA)
Summary: USD/JPY extends weakness ahead of key US data. Technical bias is bearish. Scope for further downside.


