


 FxWirePro: GBP/USD heads deeper into bear territory, 23.6% fibonacci eyed
  FxWirePro: GBP/NZD gaining momentum for a move towards 2.3100 level
  Fed May Resume Rate Hikes: BofA Analysts Outline Key Scenarios
  FxWirePro: GBP/NZD gaining momentum for a move towards 2.3350level
  FxWirePro: AUD/USD eases after Australian mixed CPI data
  Stock Futures Dip as Investors Await Key Payrolls Data
  FxWirePro: NZD/USD downside pressure builds, key support level in focus
  FxWirePro- Major Pair levels and bias summary
  Wall Street Analysts Weigh in on Latest NFP Data
  U.S. Stocks vs. Bonds: Are Diverging Valuations Signaling a Shift?
  China’s Growth Faces Structural Challenges Amid Doubts Over Data
  FxWirePro: GBP/USD slides toward critical support market reassesses UK political transition
  FxWirePro: USD/CAD hits 14-month high , Scope for further upside
  NZDJPY Bears Reload as 92 Resistance Caps Bounce; Sell-on-Rallies Eyed Toward 90
  Sterling Slump Sends GBPJPY Toward 212.60 — Bearish EMA Stack Eyes 210
  FxWirePro- Major Pair levels and bias summary
  FxWirePro: AUD/USD drifts lower, uninspired by jobs beat


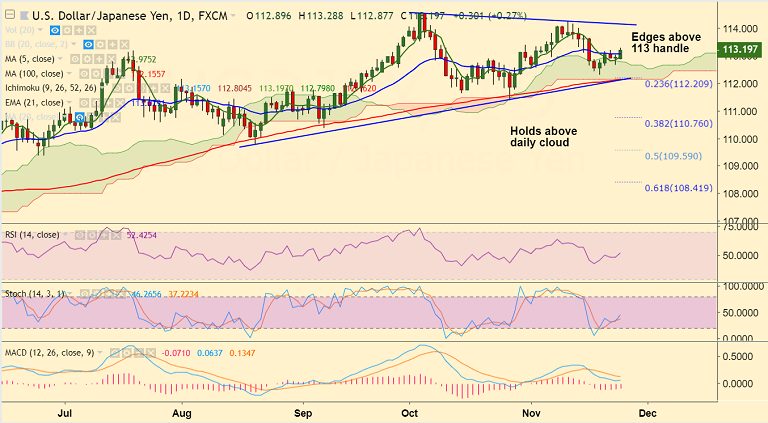
USD/JPY chart on Trading View used for analysis
- USD/JPY has broken above 113 handle and is currently trading at 113.21 after hitting session highs at 113.28.
- Rise in in the S&P 500 futures amid risk-on weighing on the Japanese yen.
- Technical studies are turning slightly bullish on the daily charts raising scope for further upside.
- The pair has broken above 21-EMA and has bounced off daily cloud on Friday's trade with a 'Dragonfly Doji' formation.
- RSI has edged above 50 mark and is biased higher along with Stochs.
- Close above 20-DMA to see test of upper Bollinger Band at 114 mark.
- Rejection at 21-EMA and slip below daily cloud to see weakness till 100-DMA.
Support levels - 113.08 (21-EMA), 112.30 (Nov 20th low)
Resistance levels - 113.38 (Oct 31 high), 114 (Upper BB)
For details on FxWirePro's Currency Strength Index, visit http://www.fxwirepro.com/currencyindex.


