


 FxWirePro: GBP/NZD remains weak, eyes 38.2%fib support
  Major FX Action Bias & US Market Sentiment: NZD/USD (Extremely Bullish) & AUD/USD (Bullish) Watchlist
  FxWirePro- Major Pair levels and bias summary
  FxWirePro- Major Crypto levels and bias summary
  US Magnificent 7 Stocks Trend Score: Amazon & Microsoft Hit Extreme Bullish (+100) as Meta Drops to -100 — Key Resistance & Support Watchlist
  FxWirePro: USD/ZAR gains as stronger dollar outweighs upbeat South Africa's trade surplus
  Nikkei Surges Past 65,000 on Suspected Yen Weakness: Tech Giants Like Advantest and NEC Lead Explosive Gains
  FxWirePro- Woodies pivot (Major)
  FxWirePro: AUD/USD gains some ground but outlook is bearish
  FxWirePro: NZD/USD consolidates overnight gains, but loses momentum
  AUDJPY Volatile After Massive Sell-Off: Sell Rallies at 113, Targeting 110 as Bearish Momentum Surges
  JPY Currency Meter Signals: NZDJPY Bullish (+25) vs CHFJPY (-100) – These Pairs Could Move Next
  FxWirePro: GBP/NZD remains weak, eyes 38.2%fib support
  FxWirePro- Major Pair levels and bias summary
  US Magnificent 7 Stocks Trend Score: Amazon & Microsoft Hit Extreme Bullish (+100) as Meta Drops to -100 — Key Resistance & Support Watchlist


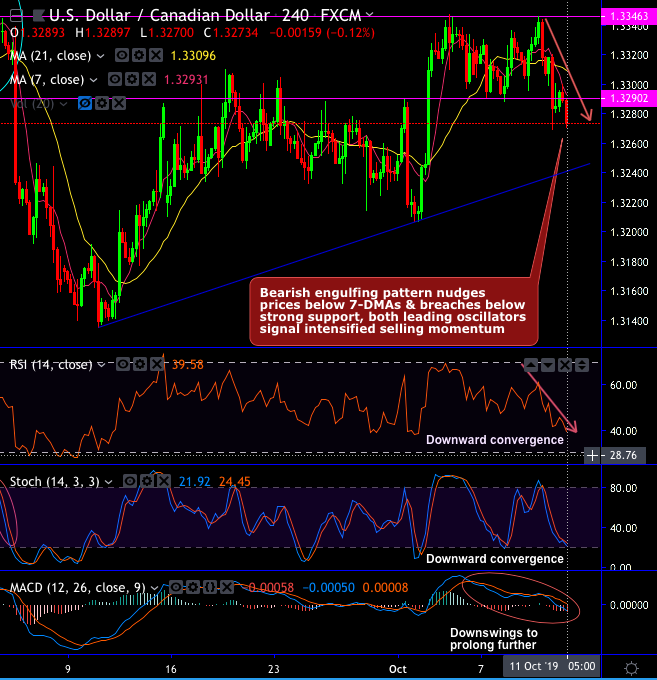
Technical Chart and Candlestick Patterns: We trace out bearish engulfing pattern candlesticks on both USDCAD’s 4H and monthly plotting of technical chart.
Consequently, the minor and major uptrends head towards trendline supports, bearish engulfing pattern nudges prices below 7-DMAs with bearish crossover and breaches down below the strong support zone 1.3290 level (earlier resistance zone, refer 4H chart).
While RSI and Stochastic curves signal intensified selling momentum as both leading oscillators show downward convergence to the prevailing price dips.
On a broader perspective, the major uptrend spikes through uptrend line (refer monthly chart), the current price hovers around 21-EMAs as both momentum & trend indicators edgy on this timeframe, the major trend attempts to bounce back above EMAs.
Dragonfly doji occurred at – 1.2463 (on monthly), and bearish engulfing at – 1.3123 and 1.3086 levels (on monthly), at 1.3327 levels on intraday chart that nudges prices below 7DMAs.
Trade Tips: On trading perspective, at spot reference: 1.3272 levels, we advise tunnel options spreads with upper strikes at 1.3290 and lower strikes at 1.3242 levels.
On hedging grounds, contemplating above technical factors we advocated shorts in futures of November’19 delivery not disregarding the CAD’s strength amid the prevailing global geopolitical risks. We wish to uphold the same strategy with a view of arresting further downside risks.


