


 NZDJPY Bulls Charge Toward 95.00: Safe-Haven Exodus Drives Kiwi Rally
  FxWirePro: EUR/CAD gains ground on prospects of resumed energy flows
  FxWirePro: GBP/NZD down trend loses steam, remains on bearish path
  FxWirePro: AUD/USD retreats slightly but trend is still bullish
  FxWirePro: GBP/AUD gains some upside momentum but still bearish
  FxWirePro: GBP/USD biased higher but rally currently stretched
  FxWirePro- Woodies Pivot(Major)
  FxWirePro: USD/CAD extends decline on broad dollar weakness
  FxWirePro:NZD/USD uptrend loses momentum but bullish setup remains
  FxWirePro: GBP/AUD positions for another drop, eyes 1.8900level
  FxWirePro- Major Pair levels and bias summary
  FxWirePro: USD/ZAR recovers slightly but trend is still bearish
  FxWirePro- Major Crypto levels and bias summary
  Ethereum Consolidates: Bullish Technicals Point to a Potential $3,000 Breakout
  FxWirePro: USD/JPY holding bid into weekend
  FxWirePro: GBP/NZD up trend gains some momentum but hurdles ahead
  Bitcoin’s Volatile Reset: ETFs Rebound as Bulls Eye USD 80,000 Milestone


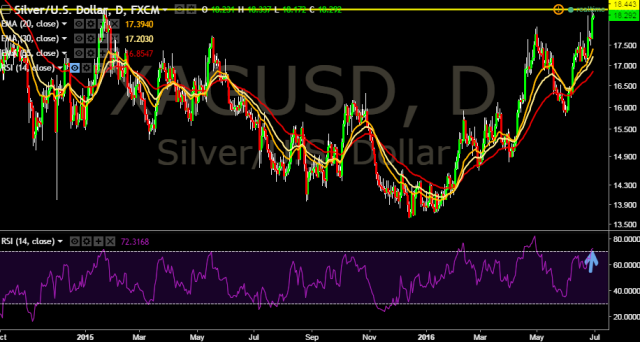
- XAG/USD is currently trading around $18.29 marks.
- It made intraday high at $18.33 and low at $18.17 levels.
- Intraday bias remains bullish till the time pair holds immediate support at $18.17 marks.
- A sustained close above $18.45 tests key resistances at $18.60, $18.68 and $18.95 marks respectively.
- On the other side, a daily close below $18.17 will take the parity down towards key supports at $17.95, $17.88, $17.60, $17.45, $17.32, $17.11, $17.02, 16.95 and $16.88 marks respectively.
- Important to note here that in a daily chart, 20D, 30D and 55D EMA heads up and confirms the bullish trend.
We prefer to take long position in XAG/USD only above $18.32, stop loss at $18.17 and target $18.60 marks.


