


 FxWirePro: USD/JPY edges higher as the yen remains vulnerable despite repeated warnings of intervention.
  FxWirePro: NZD/USD downside pressure builds, key support level in focus
  FxWirePro- Major Crypto levels and bias summary
  Aussie-Yen Trapped Below 113: Sell the Bounce as Bears Reload for a Run at 110
  FxWirePro: AUD/USD climbs as US-Iran peace deal sparks risk rally
  Pound-Yen Pullback: GBP/JPY Slips Below Key EMAs as Sterling Weakness Fuels Bearish Bet on 210
  Peace Dividend Powers NZDJPY Past 93.50 — Bulls Set Sights on 96.15 Target
  FxWirePro: GBP/AUD runs out of steam but maintains bullish outlook
  FxWirePro: EUR/AUD bullish outlook with scope to target 1.6500
  FxWirePro: GBP/NZD stuck in range but outlook is bullish
  FxWirePro: GBP/AUD steadies around 0.9145 ,retains bid tone
  FxWirePro- Woodies pivot (Major)


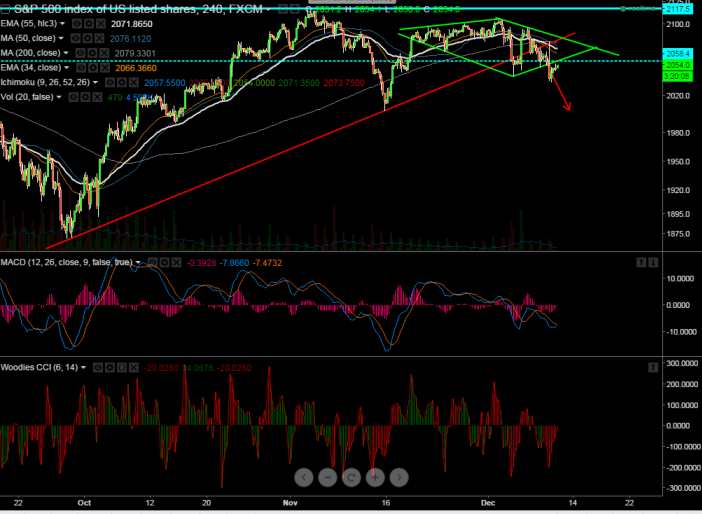
- Pattern formed -Diamond Formation
- Major intraday resistance - 2085 (trend line joining 2106 and 2096)
- S&P 500 has broken major support (diamond formation) level around 2050 and declined till 2035. The index has recovered till 2079 and it is currently trading around 2050. Short term trend is still weak as long as resistance 2085 holds.
- Any break below diamond formation confirms minor weakness, a decline till 2020/2000 is possible .
- On the higher side any break above 2085 will take the index till 2096/2106 level.
It is good to sell on rallies around 2060-65 with SL around 2085 for the TP of 2025/2003


