


 Bank of America Posts Strong Q4 2024 Results, Shares Rise
  Fed Governor Lisa Cook Warns Inflation Risks Remain as Rates Stay Steady
  U.S. Stocks vs. Bonds: Are Diverging Valuations Signaling a Shift?
  U.S. Treasury Yields Expected to Decline Amid Cooling Economic Pressures
  BTC Flat at $89,300 Despite $1.02B ETF Exodus — Buy the Dip Toward $107K?
  Wall Street Analysts Weigh in on Latest NFP Data
  Goldman Predicts 50% Odds of 10% U.S. Tariff on Copper by Q1 Close
  Lithium Market Poised for Recovery Amid Supply Cuts and Rising Demand
  Bank of England Expected to Hold Interest Rates at 3.75% as Inflation Remains Elevated
  RBA Expected to Raise Interest Rates by 25 Basis Points in February, ANZ Forecast Says


The US April retail sales has disappointed a day of important releases. The US data (retail sales -16.4%, industrial production -11.2%, Empire Index -48.5%) might fuel global economic concerns on the markets again. Even if it became obvious that the pandemic coronavirus crisis was affecting the economy in a much more pronounced and above all sustainable manner than presumed so far, the effects on the exchange rates would be quite limited in the end. While the central banks certainly those in the G10 universe have pretty much used up their interest rate tool, and thus the main driver of exchange rates.
Yes, for some countries the possibility of negative interest rates is still being debated, but one thing is clear: even then there would not be much scope to the downside. The fact that many central banks, such as Fed, Bank of England or even the Riksbank, who already used negative rates in the past, are hesitant about this step illustrates that we are talking about rate cuts by 25bp or a maximum of 50bp. Anything of that scale is no justification for major exchange rate moves. As a result the continued fall in the implied exchange rate volatilities seems justified for us.
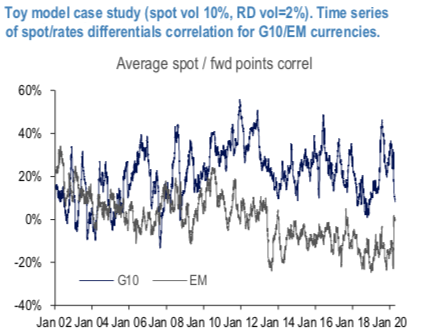
While the value of the spot/rates differential correlation plays a crucial role in the shape of the vol curve, as discussed above. Intuitively, a positive correlation between spot and rates differentials should limit the volatility of forward contracts as the effect above is countered by a move of the spot in the direction where the higher yielding currency appreciates. Same reasoning applies when rates differentials tighten. Conversely, when the correlation is negative, the effect is magnified, and forwards are expected to move more than the spot variable. The time series of average values of (3M historical correlations) for G10/EM USD pairs (refer above chart) tells a structurally different story in the two spaces. For G10 this value is positive (long-term average =20%), for EM much lower (long-term average =2%) and negative over the past 8 years. While carry investment strategies favor assets where yields are higher or faster rising, in the EM space high or rising rates are often associated with higher default risk. Typically, the dynamics between rates and FX depends on the currency more granular details on individual currencies investigated will be shared later. Courtesy: JPM


