


 FxWirePro: GBP/NZD remains weak, eyes 38.2%fib support
  FxWirePro- Major Pair levels and bias summary
  NZDJPY Retreats on Yen Strength – Bearish Setup Targets 90 After Hitting 92.75 Low
  JPY Currency Meter Signals: NZDJPY Bullish (+25) vs CHFJPY (-100) – These Pairs Could Move Next
  FxWirePro: USD/ZAR gains as stronger dollar outweighs upbeat South Africa's trade surplus
  FxWirePro: USD/CNY dips to hit three year low,scope for further downside
  US Magnificent 7 Stocks Trend Score: Amazon & Microsoft Hit Extreme Bullish (+100) as Meta Drops to -100 — Key Resistance & Support Watchlist
  Major European Indices Score Extremely Bullish: DAX Eyes 26000, CAC Targets 8600, FTSE100 at 11000 – Key Levels to Watch
  FxWirePro: AUD/USD gains some ground but outlook is bearish
  Major FX Action Bias & US Market Sentiment: NZD/USD (Extremely Bullish) & AUD/USD (Bullish) Watchlist
  AUD/JPY Slips Below 112 as BOJ Intervention Sparks Bearish Momentum: Sell the Rallies
  FxWirePro: GBP/USD rises as soft US data pressures dollar
  FxWirePro:USD/JPY climbs back above 160.00 after BOJ rate decision
  US Magnificent 7 Stocks Trend Score: Amazon & Microsoft Hit Extreme Bullish (+100) as Meta Drops to -100 — Key Resistance & Support Watchlist
  FxWirePro- Major Crypto levels and bias summary
  FxWirePro: GBP/AUD drifts lower after BOE rate decision


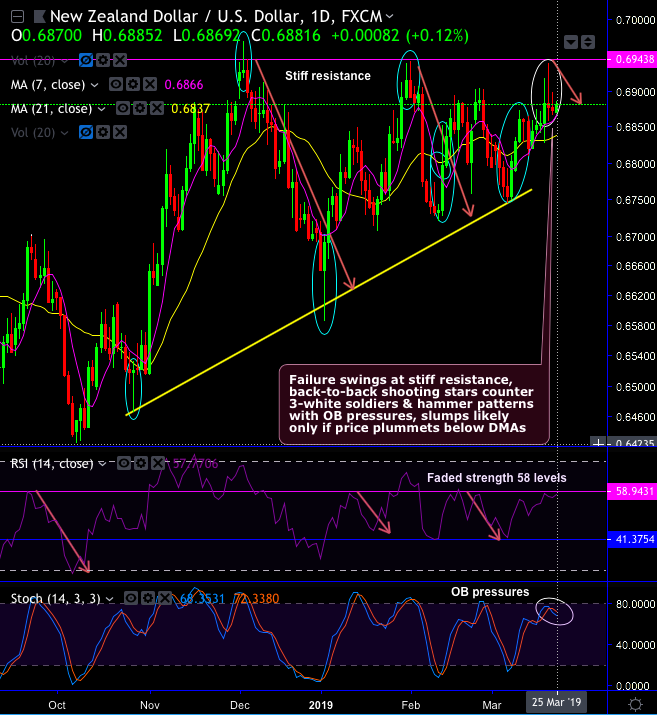
Kiwis dollar has been attempting to spike from the last couple of days after some bullish patterns.
In fact, we raised a cause of concern about these bullish candles in our previous post, ever since then there was a stiff tug of war between bulls and bears, and the trend moved nowhere from that level. For more reading on our previous call, please refer below link for our historic write-ups:
We hope you are now in sync with what we meant to convey about NZDUSD trend.
Hadn’t we highlighted bullish potential in the interim trend? But for now, NZDUSD interim uptrend seems to be exhausted upon the failure swings at the stiff resistance of 0.6945 levels, that is where back-to-back shooting stars have occurred to counter previous 3-white soldiers & hammer patterns (refer both daily).
The occurrences of back-to-back shooting stars at 0.6876 and 0.6873 are backed by overbought pressures that are signaled by the momentum oscillators also, thereby, slumps seem to be likely only if price plummets below DMAs, otherwise we may see mild rallies.
The intermediary bullish trend and the consolidation phase spikes through the uptrend line (refer both daily and monthly plotting).
The pair forms hammer patterns at the uptrend line, to be precise, 0.6520, 0.6691 levels on the daily chart and 0,6390 levels on monthly terms.
3-white soldiers and bullish engulfing pattern candles have occurred at 0.6860 and 0.6879 levels on daily and monthly terms respectively.
All these bullish patterns cushion the interim uptrend and the consolidation phase on the major downtrend.
But for now, the interim uptrend is slightly dubious as both RSI and stochastic curves show downward convergence ahead of RBNZ’s monetary policy.
Bears may resume and extend the major downtrend at any time, unless and until bulls manage to break-out 21-EMAs decisively (monthly chart). Bears will have the equal opportunity upon breach below the triple top neckline, both leading & lagging indicators, on this timeframe, are still slightly bearish bias in the major downtrend.
Trade tips: Well, on trading perspective, at spot reference: 0.6880 levels, contemplating above-stated technical rationale, it is advisable to deploy boundary strikes option strategy using upper strikes at 0.6905 and lower strikes at 0.6857, the strategy is likely to fetch leveraged yields as long as the underlying spot FX remains between these two strikes on the expiration.
Alternatively, on hedging grounds, we advocated shorting futures contracts of mid-month tenors ahead of US Fed’s monetary policy in the recent past, as the underlying spot FX likely to target southwards 0.66 levels in the medium-term, we wish to uphold the same strategy ahead of RBNZ’s monetary policy that is scheduled for this week.
Writers in a futures contract are expected to maintain margins in order to open and maintain a short futures position.
Currency Strength Index: FxWirePro's hourly NZD spot index is inching towards 120 levels (which is bullish), while hourly USD spot index was at -18 (mildly bearish) while articulating (at 06:09 GMT).
For more details on the index, please refer below weblink: http://www.fxwirepro.com/currencyindex


