


Refer NZD/USD chart on Trading View
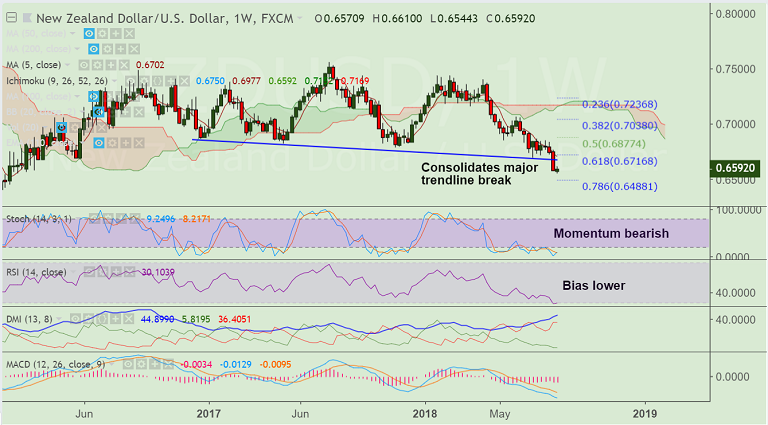
- NZD/USD is consolidating break below major trendline support at 0.6685.
- Downtrend in the pair remains intact, we do not see any major signs of reversal.
- Price action has edged above 5-DMA and is currently trading 0.21% higher on the day at 0.6599.
- We see minor upside on intraday charts, price is extending sideways along hourly 110-EMA.
- We see further bullishness only on breakout at hourly 200-SMA at 0.6627. Scope then for test of 21-EMA at 0.6685. Break above 21-EMA could invalidate bearish bias.
- On the flipside, we see scope for weakness till 0.6347 (Jan 2016 low)
Support levels - 0.6579 (5-DMA), 0.6488 (78.6% Fib), 0.64, 0.6428 (Nov 2015 low)
Resistance levels - 0.66, 0.6685 (21-EMA), 0.67
FxWirePro Currency Strength Index: FxWirePro's Hourly NZD Spot Index was at 87.3714 (Bullish), while Hourly USD Spot Index was at -82.8661 (Bearish) at 0715 GMT. For more details on FxWirePro's Currency Strength Index, visit http://www.fxwirepro.com/currencyindex.


