


 Bitcoin Reclaims $65,000 as Easing Geopolitical Tensions Fuel Risk-On Rally
  FxWirePro: EUR/ AUD neutral in the near term, scope further downside
  DAX & CAC40 Score Perfect 100: Extremely Bullish With Major Levels to Watch as FTSE100 Hits 80
  FxWirePro: USD/CNY slips as strong China exports data Lift yuan
  FxWirePro: USD/JPY holds tight range ahead of key U.S. payrolls data
  FxWirePro- Major Pair levels and bias summary
  FxWirePro: GBP/AUD under pressure after disappointing U.S. employment data
  EURGBP Bears Break Trendline: Sell Rallies at 0.8578 as Support Breach Eyes 0.8450 Slide
  FxWirePro- Major Crypto levels and bias summary
  FxWirePro : EUR/NZD holding below 38.2% fibo ahead of US data
  FxWirePro : USD/CAD falls as strong Canadian jobs data lifts loonie
  FxWirePro: AUD/USD eases as investors await U.S. employment figures
  FxWirePro- Major Pair levels and bias summary
  Major Pair Currency Score: NZD/USD and AUD/USD Lead Forex Rally with Perfect 100 Scores


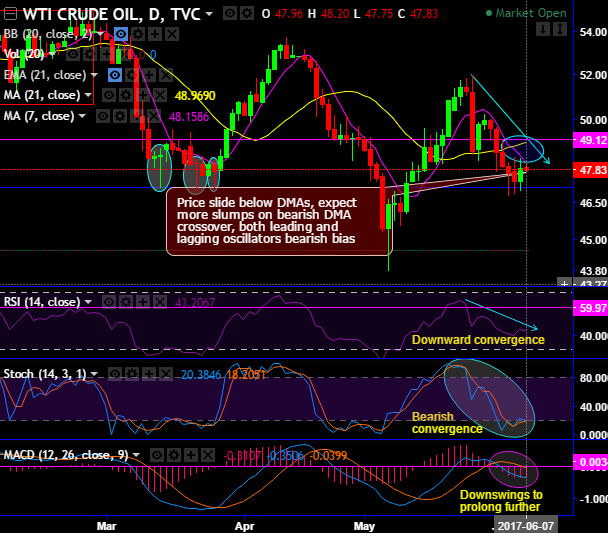
On daily charts of this energy commodity prices, although the bulls attempt to bounce the strong resistance at 48.16 levels (7DMA) have restrained (day highs at 48.20).
The shooting star occurred at 51.27 levels, consequently, the price slides below DMAs, for now, we expect more slumps on bearish DMA crossover, both leading and lagging oscillators have been bearish bias (refer daily charts).
RSI on this timeframe indicates the stern bearish trend, while same has been the case on stochastic curves, this leading oscillator has been indecisive but slightly bearish bias.
The Saudi Arabia, Bahrain, and UAE cut diplomatic ties with Qatar as Gulf rift deepens, this topic continues to be the hot topic for the day. While US inflation fell to -0.2% MoM. While crude inventories have declined to -6.4 million barrels as on last US crude oil inventory check.
While on a broader perspective, the major trend still goes in non-directional but bearish bias, the consolidation phase in the major downtrend now seems to be exhausted. Bears have managed to breach below the baseline of ascending triangle likely to cause more weakness in upcoming months, both leading & lagging oscillators indicates price slumps (see the rectangular area on monthly charts).
Both leading indicators are indicative of overbought pressures, stochastic curves have been indicating downward convergence right from 80 levels, as there has been %D crossover which is a sell indication. Subsequently, RSI also evidences downward convergence to the price slumps which is indicating the strength in prevailing downswings.
While MACD indicates the slumps in the prices on monthly terms remaining bearish trajectory. Overall, you see no traces of indications of robust uptrend at this juncture.
Trade tips:
Well, on intraday terms, as there is a mixed bag of technical indications, we advocate buying boundary binary options for speculation. On trading perspective, it is advisable to buy boundary binaries with upper strikes at 48.20 and lower strikes at 47.41 levels; the strategy is likely to fetch leveraged yields as long as underlying spot FX remains within these strikes on or before the binary expiry duration.
Alternatively, ahead of today's EIA's inventory check, we recommend shorting rallies on hedging grounds and decide to initiate shorts in futures contracts with near month tenor.
Well, at spot reference: 47.93, contemplating lingering bearish indications, on hedging grounds we recommend shorting near-month month futures as the underlying spot FX likely to target southwards 47 levels in near run and 45.44 levels upon breach below 1st target.
Writers in a futures contract are expected to maintain margins in order to open and maintain a short futures position.







