


 Nikkei Surges Past 65,000 on Suspected Yen Weakness: Tech Giants Like Advantest and NEC Lead Explosive Gains
  FxWirePro: GBP/USD rises as soft US data pressures dollar
  FxWirePro: USD/ CNY hits one-month low,scope for futher downside
  FxWirePro- Major Crypto levels and bias summary
  FxWirePro: USD/JPY edges higher as focus shifts to BOJ decision
  Major European Indices Score Extremely Bullish: DAX Eyes 26000, CAC Targets 8600, FTSE100 at 11000 – Key Levels to Watch
  FxWirePro- Major Pair levels and bias summary
  FxWirePro: EUR/AUD regains upwards momentum but unable to hold above 50%fib level
  FxWirePro- Major Pair levels and bias summary
  FxWirePro: USD/CNY dips to hit three year low,scope for further downside
  FxWirePro : GBP/NZD strongly bearish despite upside attempts
  NZDJPY Retreats on Yen Strength – Bearish Setup Targets 90 After Hitting 92.75 Low
  AUD/JPY Slips Below 112 as BOJ Intervention Sparks Bearish Momentum: Sell the Rallies
  JPY Action Bias: EURJPY and CADJPY Emerge as Extremely Bullish Pairs to Watch
  AUDJPY Volatile After Massive Sell-Off: Sell Rallies at 113, Targeting 110 as Bearish Momentum Surges
  FxWirePro: NZD/USD consolidates overnight gains, but loses momentum


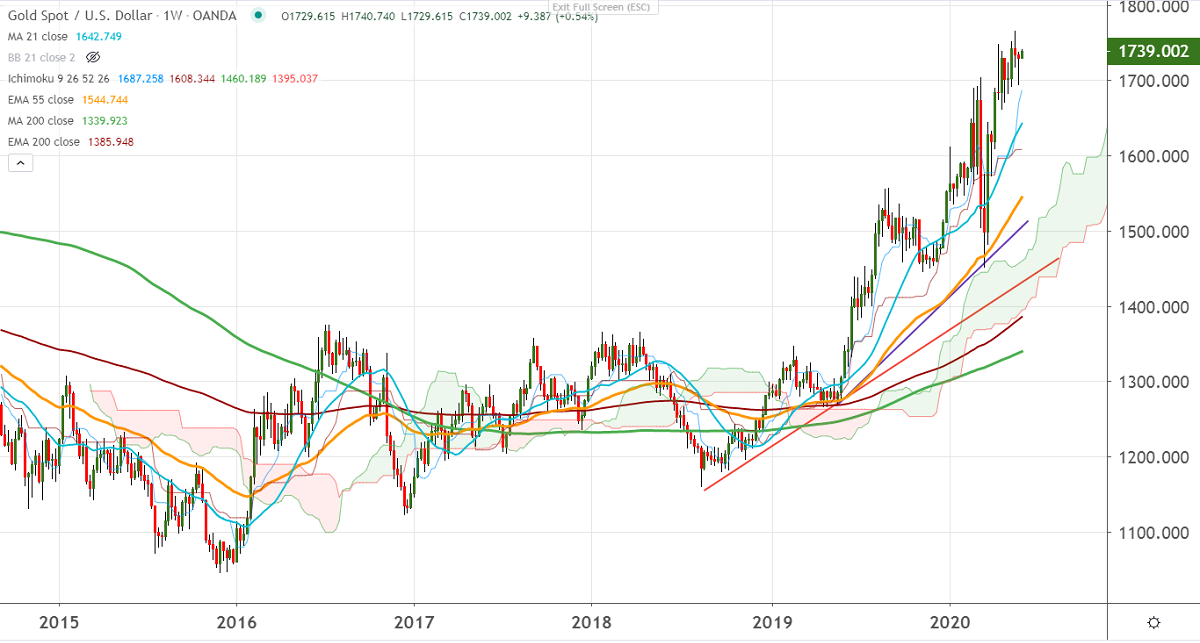
Candlestick pattern- Hammer
Ichimoku Analysis (weekly chart)
Tenken-Sen- $1669
Kijun-Sen- $1602
Gold showed a nice recovery of more than $50 from a low of $1693.80. The sell-off in the US dollar and stimulus program of various Central banks are supporting the yellow metal at lower prices. DXY has closed below 200-day MA for 2 consecutive days and any violation below 97.80 (61.8% fib) will drag the index down till 97.40/97. The yellow metal hits a high of $1740.74 at the time of writing and is currently trading around $1737.77.
US economic data
US Durable goods orders plunged sharply to -17.2% in Apr, most since Aug2014. The number of people filed for unemployment claims came at 2123K in the previous week, the lowest level since the corona pandemic. US personal spending declined to record 16% in Apr MOM as the savings rate increased by 33%.
US Dollar Index – Bearish (positive for Gold)
S&P500- bullish (negative for gold)
US Bond yield- Weak (positive for gold)
Technicals:
The yellow metal has broken 1-week high $1740 and is hovering around that level. The overall trend is bullish as long as support $1691 (23.6% fib) holds. Any violation below will drag it down to $1680/$1671.
The immediate resistance is around $1741, any indicative break beyond targets $1755/$1765. Significant trend continuation can be seen only if it surges past $1765, a jump till $1800 likely.
It is good to buy on dips around $1725-26 SL around $1718 for the TP at $1764.


