


 FxWirePro- Major European Indices
  FxWirePro: EUR/CAD gains ground on prospects of resumed energy flows
  FxWirePro: EUR/AUD under pressure as key support gives way
  FxWirePro: GBP/NZD down trend loses steam, remains on bearish path
  FxWirePro: USD/CAD recovers slightly but bearish outlook persists
  FxWirePro: AUD/USD retreats slightly but trend is still bullish
  FxWirePro: GBP/AUD positions for another drop, eyes 1.8900level
  FxWirePro: USD/JPY holding bid into weekend
  FxWirePro: GBP/AUD gains some upside momentum but still bearish
  FxWirePro: USD/CAD extends decline on broad dollar weakness
  FxWirePro- Major Crypto levels and bias summary
  FxWirePro- Woodies Pivot(Major)
  FxWirePro:NZD/USD uptrend loses momentum but bullish setup remains
  FxWirePro: USD/ZAR edges lower ,investors remain on edge
  FxWirePro: GBP/USD bulls remain cautiously optimistic
  Ethereum Consolidates: Bullish Technicals Point to a Potential $3,000 Breakout


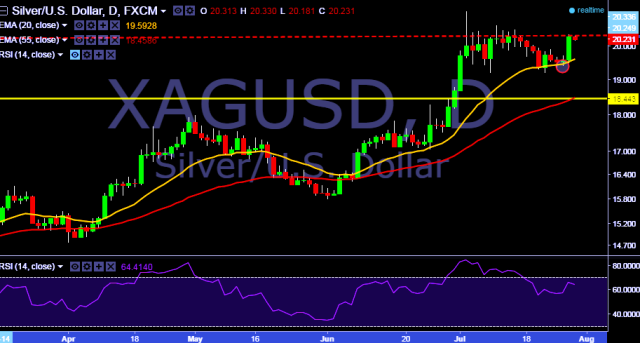
- XAG/USD is currently trading around $20.23 marks.
- It made intraday high at $20.33 and low at $20.18 levels.
- Intraday bias remains bullish till the time pair holds key support at $19.96 levels.
- A daily close above $20.38 tests key resistances at $20.45, $20.66, $20.78, $21.09 and $21.46 marks respectively.
- On the other side, a daily close below $20.00 will take the parity down towards key supports at $19.78, $19.41, $19.28, $19.17, 19.12, $19.09, $18.87 and $18.68 marks respectively.
- Important to note here that in a daily chart, 20D, 30D and 55D EMA heads up and confirms the bullish trend in a daily chart.
We prefer to take long position in XAG/USD around $20.20 with stop loss at $20.05 and target of $20.46.


