


 FxWirePro: USD/CNY hovers near 3-1/2-year low ahead of U.S. data
  FxWirePro- Major Crypto levels and bias summary
  FxWirePro: GBP/USD trades sideways as markets await U.S. inflation and UK GDP data
  FxWirePro: GBP/AUD risks tilt further to the downside
  FxWirePro:NZD/USD drifts lower, could be on verge of bigger drop
  FxWirePro: GBP/USD gives up gains as traders await UK GDP
  Major Crypto Pair Crypto Score: BNBUSD Extremely Bullish at 100, Dominating as XRPUSD Turn Deeply Bearish
  Nikkei Blasts Past 67K: AI Chip Frenzy Ignites 9% Surge From Yen Intervention Bottom
  Major Pair Currency Score: GBPUSD and AUDUSD Extremely Bullish, NZDUSD Bullish
  FxWirePro: USD/CAD hits two-month low as oil prices rise
  FxWirePro: USD/ZAR eyes downside as dollar eases after US CPI data
  FxWirePro: NZD/USD drifts lower as markets await US inflation data
  NZDJPY Bullish Consolidation: Buy Dips Near 93 with Targets at 95 as All EMAs Align Strongly Bullish
  NZDJPY Bullish at 365-EMA Support: Buy Dips Toward 95 Target
  Major Pair Currency Score: GBPUSD and AUDUSD Extremely Bullish at 100, USDCAD Extremely Bearish at -100 – Key Major Levels to Watch
  FxWirePro: EUR/NZD neutral in the near-term, scope for downward resumption
  FxWirePro: AUD/USD in holding pattern as market await fresh catalyst


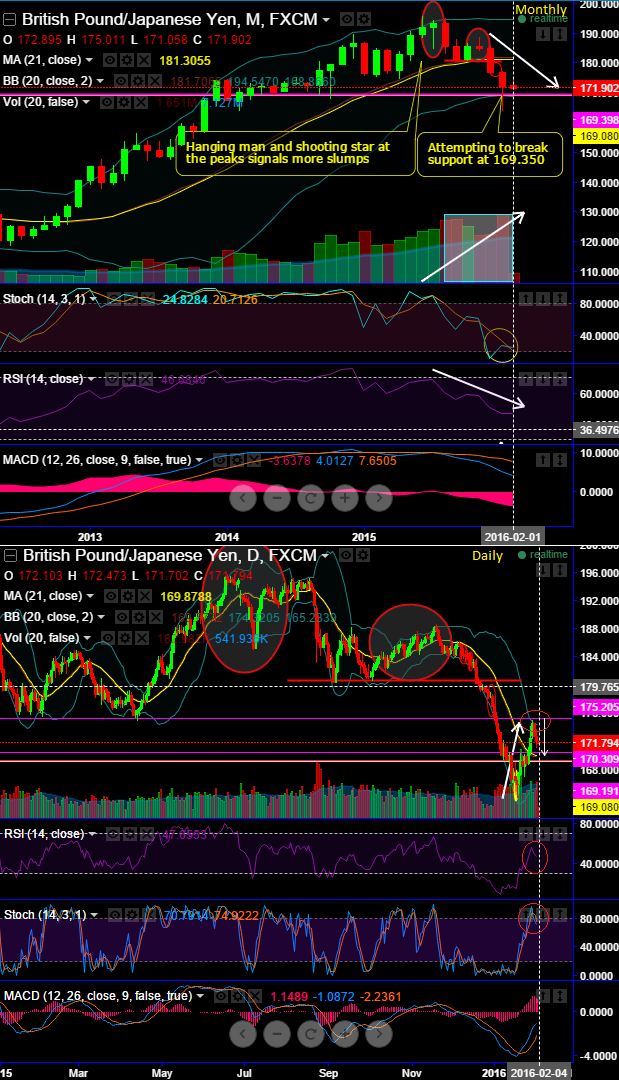
The hammer formation at the bottom of downtrend at around 165.927 on daily chart, has shown its relieving effects for interim bulls to reach out upto the highs of 175.011 as anticipated. But that is where it has now rejected the resistance exactly at upper Bollinger band to evidence more slumps.
To substantiate this bearish view, daily leading oscillators began diverging to the previous rallies. Slow stochastics has shown a bearish crossover above overbought territory, while RSI (14) has taken U turn to signify the selling momentum.
On monthly charts, for long term investors in this pair undoubtedly we continue to foresee further bearish travel from here onwards with some minor abrupt rallies.
When traced out hanging man formation at peaks, it has already dropped to 163.98 thereby, it has reached our previous 1st target at 165 and is close to 2ndtargets at 163.500 in the recent past, rest is history by now.
During this bearish travel, with all leading as well lagging indicators to converge these price slumps on monthly chart we position our bearish stance in sync with market sentiments.
Long term trend has been extremely conducive for bears as we listed out series of red flags that signifies serious weakness in this pair, most importantly, spiking volumes with dipping price.
Huge volumes conformity to the steep slumps has been booster for this bearish trend, what else do we need more than this? rising volumes with consistent falling price would reveal what is cooking in this pair.
In between, short term bulls can also be favored with these short term rallies but keep mind that any point of time it may reverse its bearish strength and resume bearish business.
Well, we've been urging for shorts utilizing momentary upswings in this pair from last 4 months, it has responded pretty much as desired for the downward targets and still with more potential.
No harm for bears with medium term trade setups as lagging indicators are pretty much the same as leading indicators, MACD and 21DMA has still been a sell both on weekly and monthly graphs. The prices have slid below 21DMA just a month ago on monthly chart that has created more room for ongoing bearish trend.
Thereby, for now an we still maintain the targets at 170.309 and even retesting of 165.50 levels are pretty much on the table upon holding the above stated resistance levels.

- News

- Economy

- Central Banks
- Investing
- Research
- Roundups
- Digital Currency
- Insights
- Technical Analysis
- Technology
- Business
- Law
- Health
- Nature
- Fintech
- Science
- Topic
- Opinions
- ©Econometrics LLC . All Rights Reserved.
FxWirePro: GBP/JPY unable to sustain upper BB resistance at 175 – more dips on table, retest of support 170.309 most likely
Thursday, February 4, 2016 8:24 AM UTC
Editor's Picks



- Market Data
Most Popular




