


 FxWirePro USD/JPY eases slightly ahead Of US June jobs report
  EURJPY Plunges Below 184 Amidst Yen Strength: Bearish Outlook Persists
  Goldman Sachs Says China Competition Weighs More on EU Growth Than Trade Deficit
  FxWirePro: USD/CNY bears maintain upper hand
  GBPJPY Surges on Yen Weakness; Bullish Trend Favors Dip Buying
  FxWirePro: USD/CAD slips on softer US payrolls but near-term direction hinges on 1.4154 support
  FxWirePro- Major Pair levels and bias summary
  FxWirePro: EUR/USD slips lower on cooler than expected Euro Zone inflation data
  FxWirePro: USD/ZAR slips as weak U.S. Jobs data weighs on dollar
  Elon Musk is remaking the world, like Henry Ford before him – but more dangerously
  FxWirePro: EUR/AUD bull’s hold the higher ground, remains on bullish path
  Buy the Dip: Gold Holds Strong at $3980, Targets $4150
  Michael Burry Shorts Tesla at $416 as AI and Semiconductor Bearish Bets Expand
  Morgan Stanley Names BAE Systems Top European Defence Stock Despite Lower Price Target
  AUDJPY Faces Headwinds: Selling on Rallies Advised as Bearish Trend Emerges


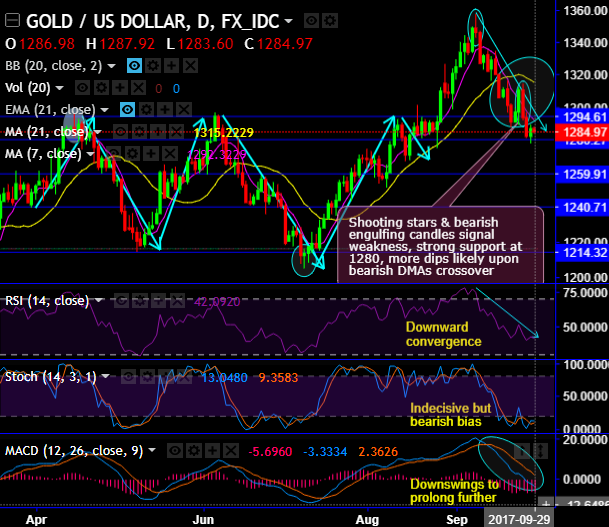
Shooting star has occurred at 1346.08 levels, historically, we’ve observed the stiff resistance at the same level (refer daily chart and magnify to see the strong supply zone). In July and September 2016, you could observe the similar resistance levels at this juncture. And for now, in September 2017, we’ve seen steep slumps after peaking to this level.
Bearish engulfing has also occurred at 1293.35 levels to slide below 7DMAs, that’s where the bears have managed to breach below the strong support levels (refer daily chart for the stiff supply zone at the same juncture in the past).
Ever since these bearish patterns have occurred, selling sentiments have piled up.
7DMA crosses below 21DMA which is a bearish DMA crossover.
While both leading oscillators (RSI & Stochastic curves) evidence downward convergence to the prevailing price dips. This signals the strength and intensified momentum in selling interests.
To substantiate this bearish stance, MACD, on the other hand, also shows bearish crossover to indicate the downswings to prolong further.
Never get puzzled by major trend – The major trend seems to be exhausted before retracing 38.2% Fibonacci levels. Historically, the prices in this consolidation phase are plummeted at the same level by popping up shooting star candle pattern.
Consequently, you could very well observe its bearish effects despite the fact that MACD was showing bullish crossover at that juncture. Overall, we reiterate that the prices have rejected the stiff resistance zone of 1357 – 1382 levels several times in past, it has again shown the weakness at that level.
Thereby, we could conclude by saying that history has repeated in gold prices.
To participate and speculate this bearish streaks, we advocate tunnel spreads using upper strikes at 1292 and lower strikes at 1280, prefer narrowed tenors in order to have the time decay advantage.
Currency Strength Index: FxWirePro's hourly USD spot index is flashing 135 (which is highly bullish), at 06:20 GMT. This figure is also conducive for the above strategy advocated. For more details on the index, please refer below weblink:
http://www.fxwirepro.com/currencyindex.
FxWirePro launches Absolute Return Managed Program. For more details, visit:


