


 AUDJPY Momentum Fades at 111: Sell Rallies to 108 as Bearish EMAs Dominate
  FxWirePro: GBP/NZD downside pressure builds, key support level in focus
  FxWirePro: AUD/USD firms after upbeat consumer spending data
  FxWirePro: NZD/USD eases as NZ unemployment surges in Q2
  FxWirePro- Major Crypto levels and bias summary
  FxWirePro: GBP/AUD consolidating around 1.9185, bias is bearish
  EUR/USD Retraces After 1.1555 Peak: Technical Levels Point to 1.1600
  FxWirePro:EUR/NZD downtrend Intact, eyes 1.9500 level
  FxWirePro: NZD/USD turns lower as USD regains footing
  FxWirePro: AUD/USD grinds higher amid risk appetite revival
  Currency Scores of Major Pairs: GBPUSD, AUDUSD & NZDUSD Top Charts at 85 — Bullish Pairs to Watch
  FxWirePro: GBP/AUD under pressure as the pair continues to weaken
  FxWirePro: USD/ZAR faces downside pressure with 38.2%fib support in focus
  Major Pair Currency Scores: GBPUSD, USDCAD, AUDUSD & NZDUSD Lead as Top Bullish Pairs to Watch
  FxWirePro: GBP/USD edges higher as markets track U.S.-Iran talks and oil moves


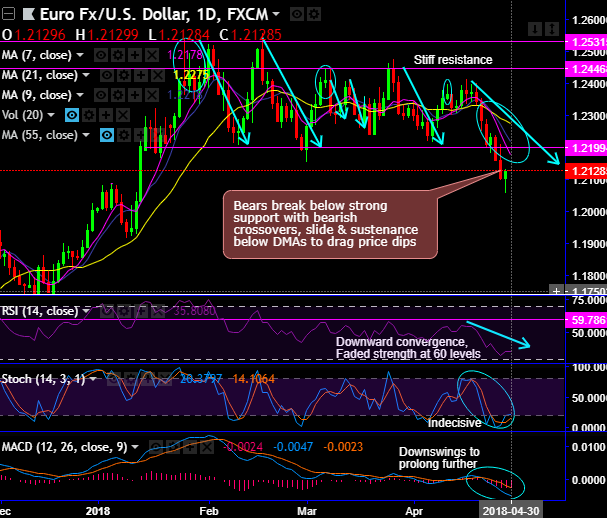
EURUSD forms back-to-back shooting star patterns at 1.2303, 1.2287, 1.2320, 1.2329 & 1.2285 levels and hanging man patterns at 1.2316 levels. The trend was oscillating between the stiff range of 1.2223 and 1.2545 levels but for now, bears have managed to break below this range (refer weekly chart).
The current price slides below 21EMA as both leading oscillators signal weakness & lagging indicators indicate downswings to prolong further.
The stiff resistance levels were observed at 1.2446 and 1.2531 levels.
The bearish pattern candle hampers previous rallies, bearish DMA crossover is most likely to drag price dips although the minor trend has been drifting in sideways for today, most likely to show the failure swings at the stiff resistance of 7DMA levels.
RSI and stochastic curves have shown downward convergence that indicates strength and intensified bearish momentum (on both daily and weekly terms).
Both trend indicators (DMA and MACD) show bearish crossovers to signal downswings to prolong further.
On a broader perspective, the consolidation phase in the major trend that was bullish now turned into bearish again. After last three months struggle for healthy bullish momentum, the current prices have popped-up flurry of bearish patterns, such as hanging man, shooting star at peak of rallies coupled with bearish MACD crossover on weekly terms.
Hence, at spot reference: 1.2132 levels, contemplating bearish sentiments in the minor trend, on trading grounds, it is advisable to buy boundary option strategy, using upper strikes at 1.2178 and lower strikes at 1.2055 levels are advocated to participate in the bearish sentiments.
Thereby, the intraday traders can speculate between upward targets about 40-45 pips on the north and about 70-75 pips southwards. The strategy is likely to fetch leveraged yields as long as underlying spot FX keeps dipping but to remain above lower strikes on the binary expiration.
Alternatively, shorting futures contracts of near month tenors are also advisable with a view to arresting potential slumps.
Currency Strength Index: FxWirePro's hourly EUR spot index is displaying shy above 16 levels (which is bullish). While hourly USD spot index was inching towards 42 (bullish) while articulating (at 06:49 GMT).
For more details on the index, please refer below weblink: http://www.fxwirepro.com/currencyindex
FxWirePro launches Absolute Return Managed Program. For more details, visit:







